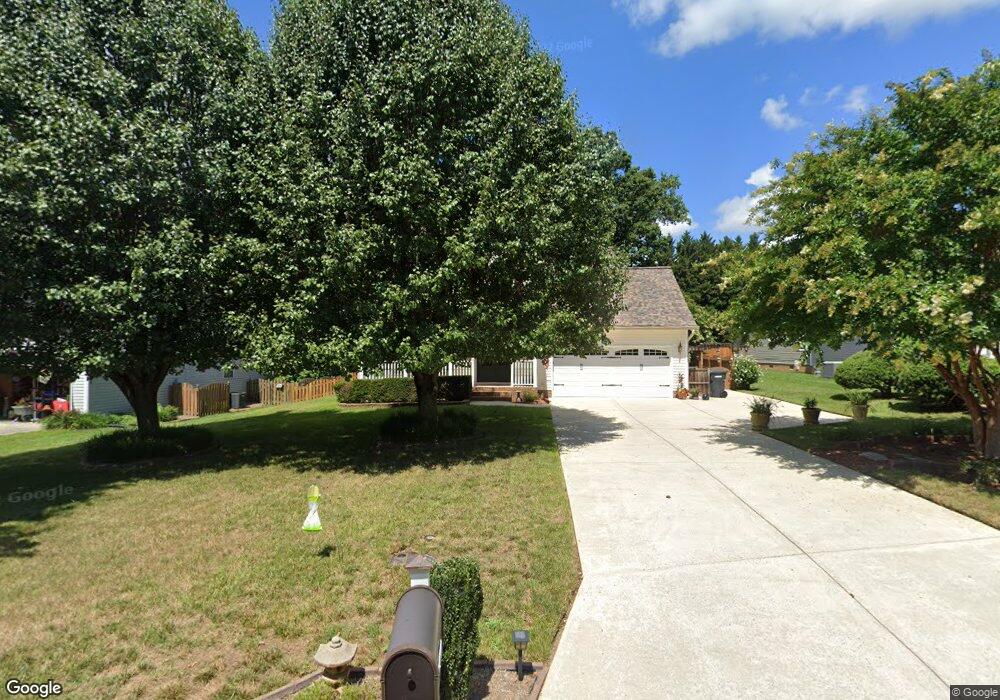
1410 Margate Ln Kernersville, NC 27284
Glenwood/Kingswood NeighborhoodEstimated Value: $340,000 - $370,000
4
Beds
3
Baths
1,999
Sq Ft
$176/Sq Ft
Est. Value
About This Home
This home is located at 1410 Margate Ln, Kernersville, NC 27284 and is currently estimated at $352,697, approximately $176 per square foot. 1410 Margate Ln is a home located in Forsyth County with nearby schools including Caleb's Creek Elementary School, Southeast Middle School, and R.B. Glenn High School.
Ownership History
Date
Name
Owned For
Owner Type
Purchase Details
Closed on
Jun 5, 2015
Sold by
Morris Michael R and Morris Juana R
Bought by
Morris Michael R
Current Estimated Value
Home Financials for this Owner
Home Financials are based on the most recent Mortgage that was taken out on this home.
Original Mortgage
$180,775
Outstanding Balance
$139,816
Interest Rate
3.79%
Mortgage Type
VA
Estimated Equity
$212,881
Purchase Details
Closed on
Mar 6, 2005
Sold by
Cates Curtis and Cates Gertrude
Bought by
Morris Michael R and Morris Juana R
Home Financials for this Owner
Home Financials are based on the most recent Mortgage that was taken out on this home.
Original Mortgage
$184,250
Interest Rate
5.8%
Mortgage Type
VA
Purchase Details
Closed on
Jun 29, 2000
Sold by
Siegman James E and Siegman Mary Lou
Bought by
Cates Curtis L and Cates Gertrud
Home Financials for this Owner
Home Financials are based on the most recent Mortgage that was taken out on this home.
Original Mortgage
$70,000
Interest Rate
6.65%
Create a Home Valuation Report for This Property
The Home Valuation Report is an in-depth analysis detailing your home's value as well as a comparison with similar homes in the area
Home Values in the Area
Average Home Value in this Area
Purchase History
| Date | Buyer | Sale Price | Title Company |
|---|---|---|---|
| Morris Michael R | $5,000 | None Available | |
| Morris Michael R | $180,000 | -- | |
| Cates Curtis L | $168,000 | -- |
Source: Public Records
Mortgage History
| Date | Status | Borrower | Loan Amount |
|---|---|---|---|
| Open | Morris Michael R | $180,775 | |
| Previous Owner | Morris Michael R | $184,250 | |
| Previous Owner | Cates Curtis L | $70,000 |
Source: Public Records
Tax History Compared to Growth
Tax History
| Year | Tax Paid | Tax Assessment Tax Assessment Total Assessment is a certain percentage of the fair market value that is determined by local assessors to be the total taxable value of land and additions on the property. | Land | Improvement |
|---|---|---|---|---|
| 2025 | $3,163 | $345,400 | $45,000 | $300,400 |
| 2024 | $3,102 | $242,600 | $39,000 | $203,600 |
| 2023 | $3,102 | $242,600 | $39,000 | $203,600 |
| 2022 | $3,092 | $242,600 | $39,000 | $203,600 |
| 2021 | $3,092 | $242,600 | $39,000 | $203,600 |
| 2020 | $2,609 | $191,700 | $31,000 | $160,700 |
| 2019 | $2,629 | $191,700 | $31,000 | $160,700 |
| 2018 | $2,571 | $191,700 | $31,000 | $160,700 |
| 2016 | $2,237 | $166,394 | $28,000 | $138,394 |
| 2015 | $2,191 | $166,394 | $28,000 | $138,394 |
| 2014 | $2,167 | $166,394 | $28,000 | $138,394 |
Source: Public Records
Map
Nearby Homes
- 1525 Fred Chapel Ln
- 130 Birch Hill Ct
- 1025 Somerset Crossing Ln
- 1020 Clyde Edgerton Dr
- 1105 Kingswood Dr
- 1100 Kingswood Dr
- 915 Mayford Dr
- 991 Beesons Field Dr
- 0 Glen Hollow Rd
- 1740 Beeson Park Ln
- 345 Silver Creek Trail
- 1117 Magenta Way
- 1225 Royal Coach Trail
- 1200 Salem Crossing Rd
- 1541 Pecan Ln
- 1547 Pecan Ln
- 1455 Amberview Ln
- 1459 Amberview Ln
- 1451 Amberview Ln
- 1463 Amberview Ln
- 1400 Margate Ln
- 1420 Margate Ln
- 105 Margate Cir
- 1128 Old Salem Rd
- 1185 Somerset Crossing Ln
- 1175 Somerset Crossing Ln
- 1195 Somerset Crossing Ln
- 100 Margate Cir
- 1165 Somerset Crossing Ln
- 115 Margate Cir
- 1124 Old Salem Rd
- 1205 Somerset Crossing Ln
- 1155 Somerset Crossing Ln
- 1131 Old Salem Rd
- 125 Margate Cir
- 110 Margate Cir
- 120 Margate Cir
- 1215 Somerset Crossing Ln
- 1145 Somerset Crossing Ln
- 1127 Old Salem Rd