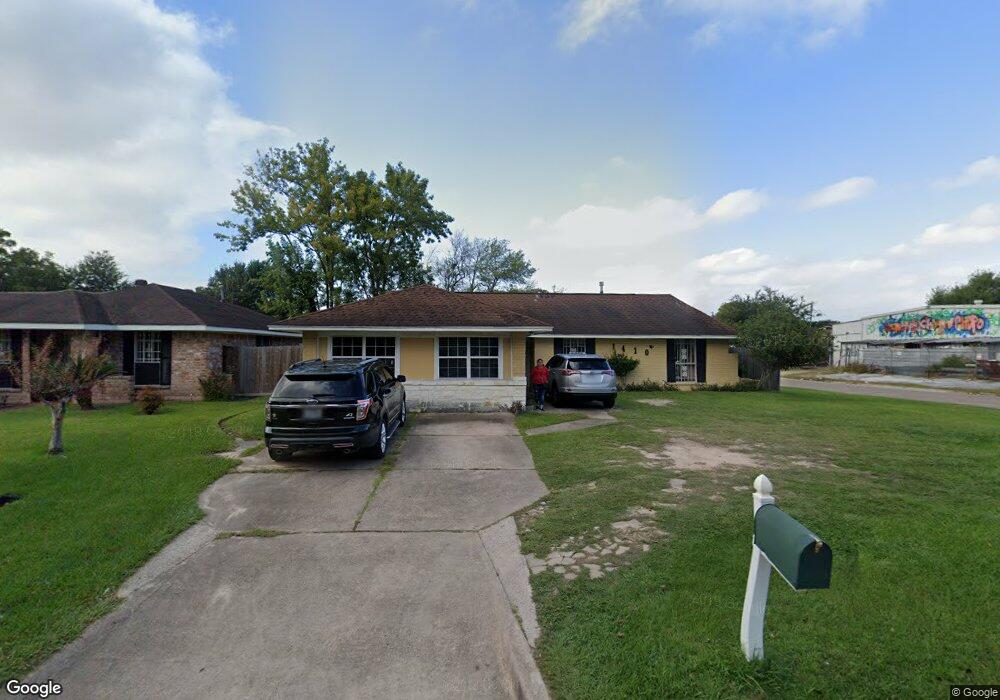
1410 Peach Spring Dr Houston, TX 77088
Acres Homes NeighborhoodEstimated Value: $184,550 - $209,000
3
Beds
2
Baths
1,064
Sq Ft
$184/Sq Ft
Est. Value
About This Home
This home is located at 1410 Peach Spring Dr, Houston, TX 77088 and is currently estimated at $195,388, approximately $183 per square foot. 1410 Peach Spring Dr is a home located in Harris County with nearby schools including Hill Intermediate School, Stovall School, and Dr. Viola K. Garcia Middle School.
Ownership History
Date
Name
Owned For
Owner Type
Purchase Details
Closed on
Aug 31, 2009
Sold by
Khera Interest Inc
Bought by
Munoz Hector A
Current Estimated Value
Home Financials for this Owner
Home Financials are based on the most recent Mortgage that was taken out on this home.
Original Mortgage
$78,551
Outstanding Balance
$51,398
Interest Rate
5.2%
Mortgage Type
FHA
Estimated Equity
$143,990
Purchase Details
Closed on
Nov 12, 2008
Sold by
Dlj Mortgage Capital Inc
Bought by
Khera Interests Inc
Purchase Details
Closed on
Jul 1, 2008
Sold by
Jones Mark
Bought by
Dlj Mortgage Capital Inc
Purchase Details
Closed on
Feb 8, 2007
Sold by
Turner Aletha Mae Drennan
Bought by
Jones Mark
Home Financials for this Owner
Home Financials are based on the most recent Mortgage that was taken out on this home.
Original Mortgage
$18,200
Interest Rate
6.17%
Mortgage Type
Stand Alone Second
Create a Home Valuation Report for This Property
The Home Valuation Report is an in-depth analysis detailing your home's value as well as a comparison with similar homes in the area
Home Values in the Area
Average Home Value in this Area
Purchase History
| Date | Buyer | Sale Price | Title Company |
|---|---|---|---|
| Munoz Hector A | -- | American Title Company | |
| Khera Interests Inc | -- | Lsi Title Agency | |
| Dlj Mortgage Capital Inc | $59,637 | None Available | |
| Jones Mark | -- | Reliable Title Company |
Source: Public Records
Mortgage History
| Date | Status | Borrower | Loan Amount |
|---|---|---|---|
| Open | Munoz Hector A | $78,551 | |
| Previous Owner | Jones Mark | $18,200 | |
| Previous Owner | Jones Mark | $72,800 |
Source: Public Records
Tax History Compared to Growth
Tax History
| Year | Tax Paid | Tax Assessment Tax Assessment Total Assessment is a certain percentage of the fair market value that is determined by local assessors to be the total taxable value of land and additions on the property. | Land | Improvement |
|---|---|---|---|---|
| 2025 | -- | $180,714 | $56,199 | $124,515 |
| 2024 | -- | $166,822 | $36,217 | $130,605 |
| 2023 | $2,721 | $166,822 | $36,217 | $130,605 |
| 2022 | $2,700 | $151,750 | $31,222 | $120,528 |
| 2021 | $2,570 | $133,467 | $31,222 | $102,245 |
| 2020 | $2,455 | $133,945 | $31,222 | $102,723 |
| 2019 | $2,340 | $115,510 | $11,240 | $104,270 |
| 2018 | $442 | $97,777 | $11,240 | $86,537 |
| 2017 | $1,854 | $97,777 | $11,240 | $86,537 |
| 2016 | $1,685 | $97,777 | $11,240 | $86,537 |
| 2015 | $225 | $78,095 | $11,240 | $66,855 |
| 2014 | $225 | $62,319 | $11,240 | $51,079 |
Source: Public Records
Map
Nearby Homes
- 1307 Saddle Rock Dr
- 1330 Mosher Ln
- 1615 Mosher Ln
- 8718 Glen Shadow Dr
- 1710 Beaver Bend Rd
- 8615 Citation Ct
- 8835 Glenhouse Dr
- 1806 Saddle Rock Dr Unit 770
- 1707 Winter Bay Ln
- 9006 Winding River Dr
- 954 W Bertrand St
- 1011 Beaver Bend Rd
- 1102 Mosher Ln
- 9018 Lazy River Ln
- 1326 Twin Falls Rd
- 1907 Bunzel St
- 9022 Indian River Dr
- 1559 Diplomat Way
- 1314 Tarberry Rd
- 1119 Twin Falls Rd
- 1414 Peach Spring Dr
- 1403 Saddle Rock Dr
- 1418 Peach Spring Dr
- 1407 Saddle Rock Dr
- 1415 Peach Spring Dr
- 1411 Saddle Rock Dr
- 8910 Ivy Spring Ln Unit 770
- 1426 Peach Spring Dr
- 1419 Peach Spring Dr
- 8912 Ivy Spring Ln Unit 770
- 1415 Saddle Rock Dr
- 1423 Peach Spring Dr
- 1430 Peach Spring Dr
- 1410 Cool Spring Dr
- 1402 Saddle Rock Dr
- 1414 Cool Spring Dr
- 1406 Saddle Rock Dr
- 1427 Peach Spring Dr
- 1422 Cool Spring Dr
- 1419 Saddle Rock Dr