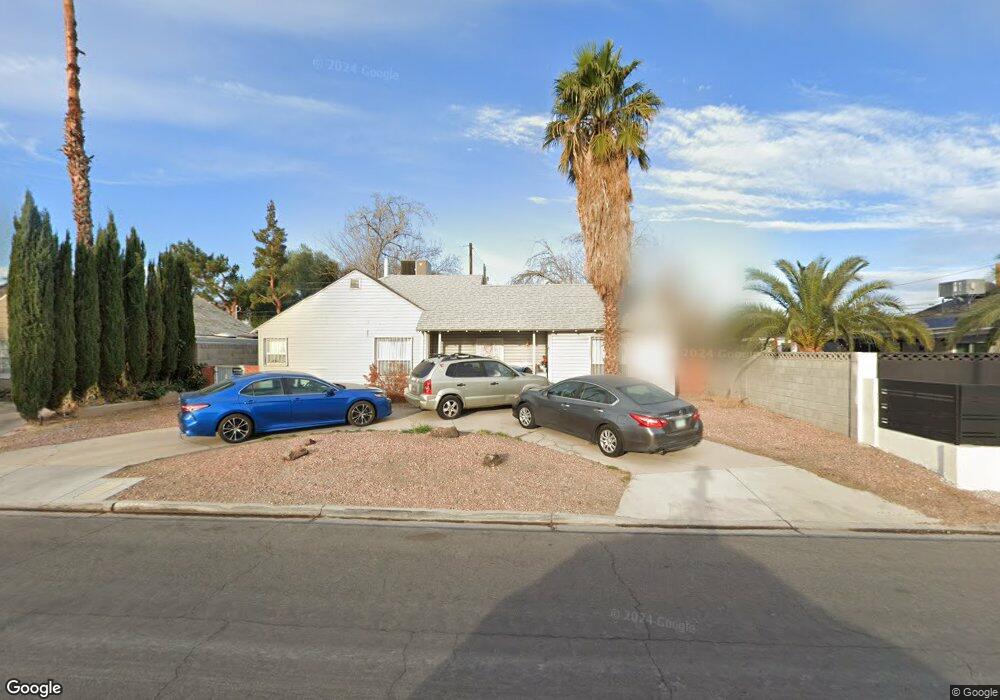
1410 S 10th St Las Vegas, NV 89104
Huntridge NeighborhoodEstimated Value: $284,000 - $388,000
3
Beds
1
Bath
1,099
Sq Ft
$304/Sq Ft
Est. Value
About This Home
This home is located at 1410 S 10th St, Las Vegas, NV 89104 and is currently estimated at $334,340, approximately $304 per square foot. 1410 S 10th St is a home located in Clark County with nearby schools including John S Park Elementary School, Roy West Martin Middle School, and Valley High School.
Ownership History
Date
Name
Owned For
Owner Type
Purchase Details
Closed on
Jun 19, 2002
Sold by
Hud
Bought by
Kirby Erica C
Current Estimated Value
Home Financials for this Owner
Home Financials are based on the most recent Mortgage that was taken out on this home.
Original Mortgage
$85,300
Outstanding Balance
$35,888
Interest Rate
6.74%
Mortgage Type
FHA
Estimated Equity
$298,452
Purchase Details
Closed on
Mar 12, 2002
Sold by
Homeside Lending Inc
Bought by
Hud
Purchase Details
Closed on
Dec 4, 2001
Sold by
Rogers Anthony G
Bought by
Homeside Lending Inc
Purchase Details
Closed on
Apr 27, 1999
Sold by
Harkess Nancy R
Bought by
Rogers Anthony G
Home Financials for this Owner
Home Financials are based on the most recent Mortgage that was taken out on this home.
Original Mortgage
$3,231
Interest Rate
6.98%
Mortgage Type
FHA
Create a Home Valuation Report for This Property
The Home Valuation Report is an in-depth analysis detailing your home's value as well as a comparison with similar homes in the area
Home Values in the Area
Average Home Value in this Area
Purchase History
| Date | Buyer | Sale Price | Title Company |
|---|---|---|---|
| Kirby Erica C | $97,000 | First American Title Co | |
| Hud | $100,160 | Equity Title | |
| Homeside Lending Inc | $100,160 | Ati Title | |
| Rogers Anthony G | -- | National Title Company | |
| Harkess Nancy R | -- | National Title Company |
Source: Public Records
Mortgage History
| Date | Status | Borrower | Loan Amount |
|---|---|---|---|
| Open | Kirby Erica C | $85,300 | |
| Previous Owner | Harkess Nancy R | $3,231 | |
| Closed | Kirby Erica C | $48,500 |
Source: Public Records
Tax History Compared to Growth
Tax History
| Year | Tax Paid | Tax Assessment Tax Assessment Total Assessment is a certain percentage of the fair market value that is determined by local assessors to be the total taxable value of land and additions on the property. | Land | Improvement |
|---|---|---|---|---|
| 2025 | $826 | $41,996 | $26,950 | $15,046 |
| 2024 | $766 | $41,996 | $26,950 | $15,046 |
| 2023 | $766 | $41,287 | $27,650 | $13,637 |
| 2022 | $709 | $33,158 | $21,000 | $12,158 |
| 2021 | $657 | $28,830 | $17,500 | $11,330 |
| 2020 | $607 | $28,509 | $17,500 | $11,009 |
| 2019 | $569 | $28,098 | $17,500 | $10,598 |
| 2018 | $543 | $26,413 | $16,450 | $9,963 |
| 2017 | $806 | $24,572 | $14,700 | $9,872 |
| 2016 | $510 | $19,014 | $9,450 | $9,564 |
| 2015 | $507 | $16,626 | $7,350 | $9,276 |
| 2014 | $492 | $14,575 | $5,950 | $8,625 |
Source: Public Records
Map
Nearby Homes
- 1420 S 8th St
- 1303 S 8th St
- 1020 Wengert Ave
- 1405 S 11th St
- 1601 S Maryland Pkwy
- 2111 S Maryland Pkwy
- 1212 S 7th St
- 913 Bonita Ave
- 1811 S 7th St
- 813 Bonita Ave
- 908 Bonita Ave
- 619 Park Paseo
- 1037 Yucca Ave
- 556 E Oakey Blvd
- 1041 E Saint Louis Ave
- 1401 E Oakey Blvd
- 1314 Jessica Ave
- 1610 S 14th St
- 1411 Norman Ave
- 1401 Jessica Ave
- 1414 S 10th St
- 910 Sweeney Ave
- 1403 S 9th St
- 1411 S 9th St
- 1500 S 10th St
- 908 Sweeney Ave
- 1415 S 9th St
- 1001 Bracken Ave
- 1000 Sweeney Ave
- 1504 S 10th St
- 1501 S 9th St
- 1007 Bracken Ave
- 1000 Bracken Ave
- 1006 Sweeney Ave Unit n/a
- 1510 S 10th St
- 820 Sweeney Ave
- 1505 S 9th St
- 1006 Bracken Ave
- 1011 Bracken Ave
- 1010 Sweeney Ave