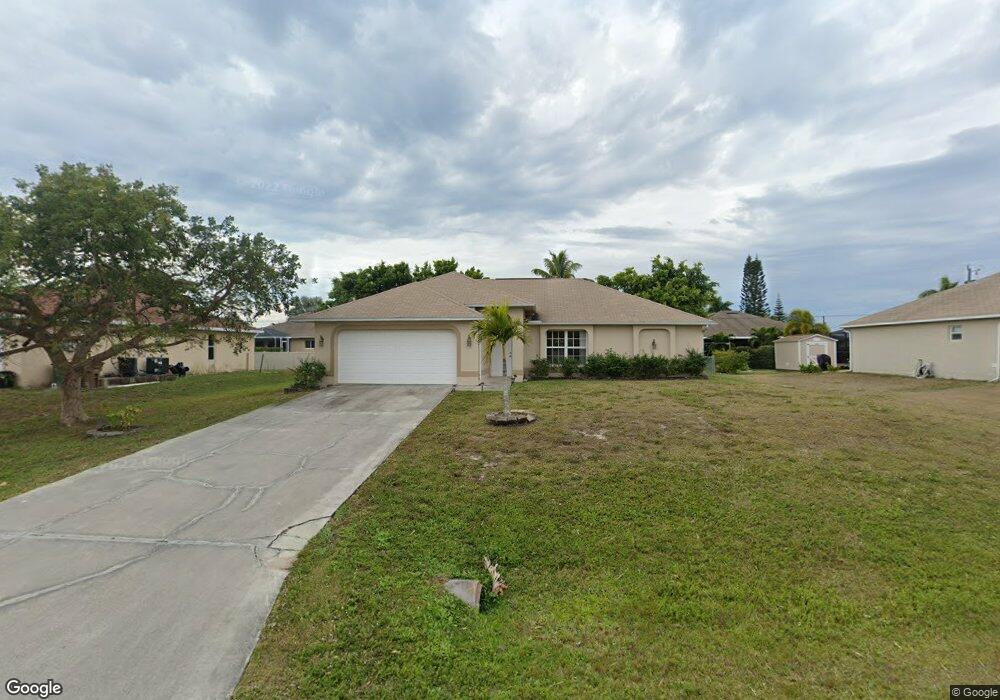
1410 SW 9th Ct Unit 63 Cape Coral, FL 33991
Trafalgar NeighborhoodEstimated Value: $240,000 - $332,000
3
Beds
2
Baths
1,644
Sq Ft
$178/Sq Ft
Est. Value
About This Home
This home is located at 1410 SW 9th Ct Unit 63, Cape Coral, FL 33991 and is currently estimated at $293,242, approximately $178 per square foot. 1410 SW 9th Ct Unit 63 is a home located in Lee County with nearby schools including Caloosa Elementary School, Tropic Isles Elementary School, and Cape Elementary School.
Ownership History
Date
Name
Owned For
Owner Type
Purchase Details
Closed on
May 29, 2011
Sold by
Harris Michael J and Harris Tina
Bought by
Corona Property Holdings Llc
Current Estimated Value
Purchase Details
Closed on
Dec 13, 2002
Sold by
Caron Timothy
Bought by
Harris Michael J and Harris Tina
Home Financials for this Owner
Home Financials are based on the most recent Mortgage that was taken out on this home.
Original Mortgage
$137,700
Interest Rate
5.92%
Mortgage Type
VA
Purchase Details
Closed on
Feb 18, 2002
Sold by
Cape Holdings Enterprises Inc
Bought by
Carson Timothy
Home Financials for this Owner
Home Financials are based on the most recent Mortgage that was taken out on this home.
Original Mortgage
$106,800
Interest Rate
7.02%
Purchase Details
Closed on
Aug 14, 2001
Sold by
Clerk Circuit Court
Bought by
Cape Holdings Ent Inc
Create a Home Valuation Report for This Property
The Home Valuation Report is an in-depth analysis detailing your home's value as well as a comparison with similar homes in the area
Home Values in the Area
Average Home Value in this Area
Purchase History
| Date | Buyer | Sale Price | Title Company |
|---|---|---|---|
| Corona Property Holdings Llc | $68,000 | Attorney | |
| Harris Michael J | $135,000 | -- | |
| Carson Timothy | $4,800 | -- | |
| Cape Holdings Ent Inc | $2,100 | -- |
Source: Public Records
Mortgage History
| Date | Status | Borrower | Loan Amount |
|---|---|---|---|
| Previous Owner | Harris Michael J | $137,700 | |
| Previous Owner | Carson Timothy | $106,800 |
Source: Public Records
Tax History Compared to Growth
Tax History
| Year | Tax Paid | Tax Assessment Tax Assessment Total Assessment is a certain percentage of the fair market value that is determined by local assessors to be the total taxable value of land and additions on the property. | Land | Improvement |
|---|---|---|---|---|
| 2025 | $5,233 | $234,331 | $66,215 | $165,988 |
| 2024 | $5,024 | $229,342 | -- | -- |
| 2023 | $5,024 | $208,493 | $0 | $0 |
| 2022 | $4,507 | $189,539 | $0 | $0 |
| 2021 | $4,176 | $172,656 | $31,236 | $141,420 |
| 2020 | $3,992 | $156,644 | $27,000 | $129,644 |
| 2019 | $3,834 | $153,424 | $27,000 | $126,424 |
| 2018 | $3,652 | $145,350 | $20,000 | $125,350 |
| 2017 | $3,462 | $134,852 | $9,300 | $125,552 |
| 2016 | $3,240 | $123,148 | $11,352 | $111,796 |
| 2015 | $3,089 | $108,198 | $8,806 | $99,392 |
| 2014 | -- | $101,704 | $7,408 | $94,296 |
| 2013 | -- | $85,789 | $6,565 | $79,224 |
Source: Public Records
Map
Nearby Homes
- 1422 SW 15th St
- 918 SW 15th St
- 1406 SW 13th St
- 613 SW 13th St
- 1313 SW 8th Ct
- 1013 SW 15th Terrace
- 910 SW 12th Terrace
- 1425 SW 11th Ct
- 1333 SW 8th Place
- 1114 SW 12th Terrace
- 1139 SW 14th St
- 1214 SW 8th Ct
- 1506 Skyline Blvd
- 815 SW Trafalgar Pkwy
- 1117 Trafalgar Pkwy
- 1121 SW 9th Ave
- 833 SW 16th Terrace
- 1124 SW 8th Ct
- 1125 SW 11th Ct
- 1511 Skyline Blvd
- 1406 SW 9th Ct
- 1414 SW 9th Ct
- 1409 SW 10th Place
- 1405 SW 10th Place
- 1413 SW 10th Place
- 1418 SW 9th Ct
- 1402 SW 9
- 1402 SW 9th Ct
- 1409 SW 9th Ct
- 1413 SW 9th Ct
- 1405 SW 9th Ct
- 1417 SW 10th Place
- 1417 SW 9th Ct
- 1401 SW 9th Ct
- 1422 SW 9th Ct
- 1323 SW 10th Place
- 1421 SW 10th Place
- 1408 SW 10th Place
- 1421 SW 9th Ct
- 1323 SW 9th Ct