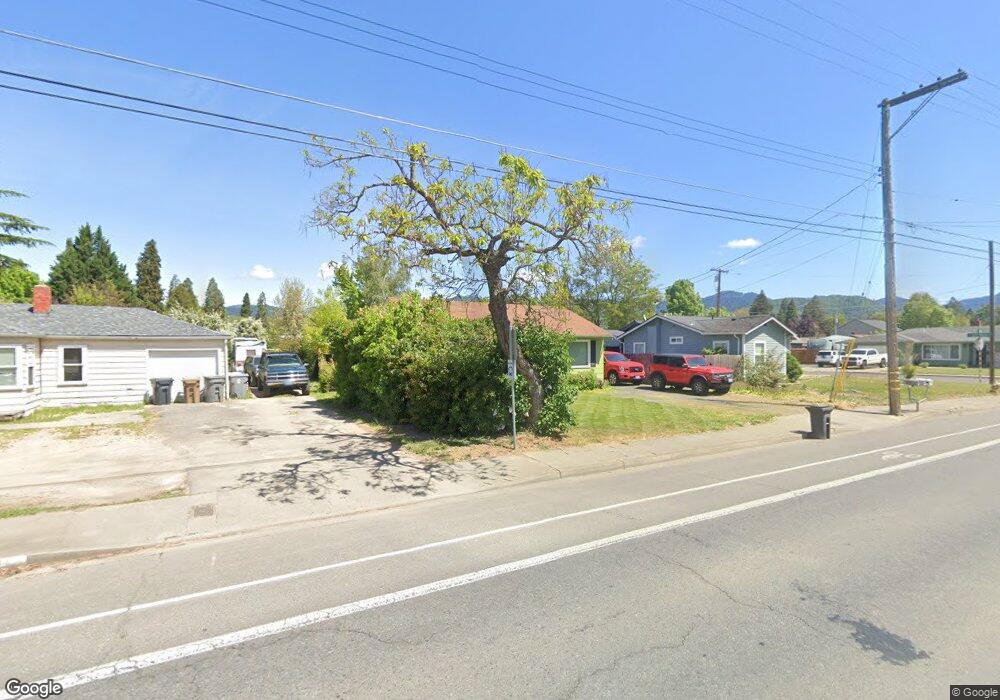
1410 SW Bridge St Grants Pass, OR 97526
Estimated Value: $244,000 - $249,702
2
Beds
1
Bath
822
Sq Ft
$300/Sq Ft
Est. Value
About This Home
This home is located at 1410 SW Bridge St, Grants Pass, OR 97526 and is currently estimated at $246,851, approximately $300 per square foot. 1410 SW Bridge St is a home located in Josephine County with nearby schools including Parkside Elementary School, North Middle School, and Grants Pass High School.
Ownership History
Date
Name
Owned For
Owner Type
Purchase Details
Closed on
Mar 31, 2025
Sold by
Lloyd Kenneth L and Lloyd Sherry L
Bought by
Ken And Sher Lloyd Trust and Lloyd
Current Estimated Value
Purchase Details
Closed on
Mar 29, 2018
Sold by
Parker Beverly C
Bought by
Lloyd Kenneth L and Lloyd Sherry L
Purchase Details
Closed on
Mar 28, 2018
Sold by
Parker Beverly C
Bought by
Lloyd Kenneth L and Lloyd Sherry L
Purchase Details
Closed on
Sep 29, 2016
Sold by
Lloyd Kenneth Lee
Bought by
Lloyd Kenneth L and Lloyd Sherry L
Home Financials for this Owner
Home Financials are based on the most recent Mortgage that was taken out on this home.
Original Mortgage
$132,943
Interest Rate
3.43%
Mortgage Type
VA
Purchase Details
Closed on
Mar 15, 2013
Sold by
Lloyd Kenneth Lee and Loyd Kathryn Marie
Bought by
Lloyd Kenneth Lee
Purchase Details
Closed on
May 16, 2005
Sold by
Emond Stephanie L and Emond Randy R
Bought by
Lloyd Kenneth L and Lloyd Kathryn M
Home Financials for this Owner
Home Financials are based on the most recent Mortgage that was taken out on this home.
Original Mortgage
$154,500
Interest Rate
5.84%
Mortgage Type
Fannie Mae Freddie Mac
Create a Home Valuation Report for This Property
The Home Valuation Report is an in-depth analysis detailing your home's value as well as a comparison with similar homes in the area
Home Values in the Area
Average Home Value in this Area
Purchase History
| Date | Buyer | Sale Price | Title Company |
|---|---|---|---|
| Ken And Sher Lloyd Trust | -- | None Listed On Document | |
| Lloyd Kenneth L | -- | None Listed On Document | |
| Lloyd Kenneth L | -- | None Available | |
| Lloyd Kenneth L | -- | First American | |
| Lloyd Kenneth Lee | -- | None Available | |
| Lloyd Kenneth L | $150,000 | First American |
Source: Public Records
Mortgage History
| Date | Status | Borrower | Loan Amount |
|---|---|---|---|
| Previous Owner | Lloyd Kenneth L | $132,943 | |
| Previous Owner | Lloyd Kenneth L | $154,500 |
Source: Public Records
Tax History Compared to Growth
Tax History
| Year | Tax Paid | Tax Assessment Tax Assessment Total Assessment is a certain percentage of the fair market value that is determined by local assessors to be the total taxable value of land and additions on the property. | Land | Improvement |
|---|---|---|---|---|
| 2025 | $1,186 | $91,300 | -- | -- |
| 2024 | $1,186 | $88,650 | -- | -- |
| 2023 | $1,117 | $86,070 | $0 | $0 |
| 2022 | $1,122 | $83,570 | -- | -- |
| 2021 | $1,054 | $81,140 | $0 | $0 |
| 2020 | $1,024 | $78,780 | $0 | $0 |
| 2019 | $994 | $76,490 | $0 | $0 |
| 2018 | $1,012 | $74,270 | $0 | $0 |
| 2017 | $1,039 | $74,620 | $0 | $0 |
| 2016 | $913 | $72,450 | $0 | $0 |
| 2015 | $857 | $70,340 | $0 | $0 |
| 2014 | $853 | $68,300 | $0 | $0 |
Source: Public Records
Map
Nearby Homes
- 1013 SW L St
- 1453 SW Silver Maple Way
- 927 SW L St
- 1019 SW J St
- 1129 SW Ballinger Dr
- 1011 SW I St
- 1719 SW Bridge St
- 1202 SW Viola Dr
- 11311133 SW Central Ave
- 1613 SW I St
- 708 SW Bridge St
- 955 SW Rogue River Ave Unit A
- 1126 SW Cottonwood St
- 1710 SW Brownell Ave
- 3487 SW Leonard St
- 253 SW Central Ave
- 207 SW Oak St
- 1950 SW Betty Ln
- 53 SW Eastern Ave Unit 53, 55
- 47 SW Eastern Ave Unit 8
- 1404 SW Bridge St
- 1406 SW Bridge St
- 1414 SW Bridge St
- 1416 SW Bridge St
- 1409 SW Bridge St
- 745 SW Greenwood Ave
- 1415 SW Bridge St
- 723 SW Cypress St
- 1403 SW Bridge St
- 719 SW Cypress St
- 739 SW Greenwood Ave
- 906 SW Greenwood Ave
- 1419 SW Bridge St
- 715 SW Cypress St
- 1142 SW Bridge St
- 725 SW Greenwood Ave
- 912 SW Greenwood Ave
- 1145 SW Bridge St
- 710 SW Greenwood Ave
- 709 SW Cypress St