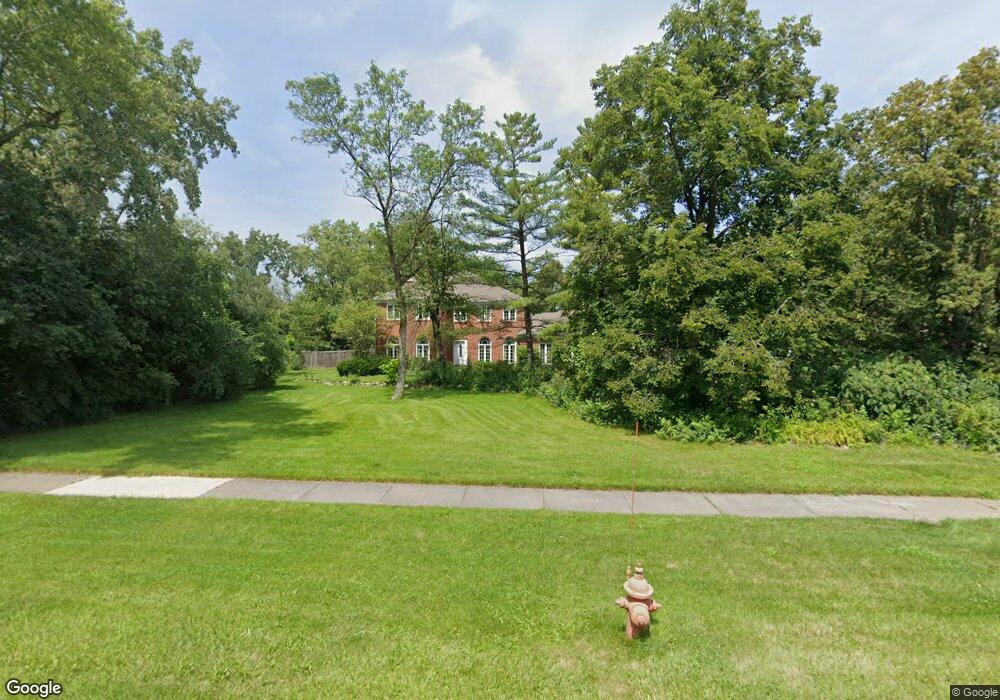
1410 W Old Mill Rd Unit 1 Lake Forest, IL 60045
Estimated Value: $1,285,000 - $1,470,000
4
Beds
4
Baths
3,526
Sq Ft
$399/Sq Ft
Est. Value
About This Home
This home is located at 1410 W Old Mill Rd Unit 1, Lake Forest, IL 60045 and is currently estimated at $1,406,942, approximately $399 per square foot. 1410 W Old Mill Rd Unit 1 is a home located in Lake County with nearby schools including Everett Elementary School, Deer Path Middle School East, and Lake Forest High School.
Ownership History
Date
Name
Owned For
Owner Type
Purchase Details
Closed on
May 9, 2011
Sold by
Jarrett Thomas M and Jarrett Christy
Bought by
Clarkson Matthew and Clarkson Lisa
Current Estimated Value
Home Financials for this Owner
Home Financials are based on the most recent Mortgage that was taken out on this home.
Original Mortgage
$640,000
Outstanding Balance
$445,384
Interest Rate
4.91%
Mortgage Type
New Conventional
Estimated Equity
$961,558
Purchase Details
Closed on
Nov 14, 1997
Sold by
Mccain William I
Bought by
Jarrett Thomas M and Jarrett Christy
Home Financials for this Owner
Home Financials are based on the most recent Mortgage that was taken out on this home.
Original Mortgage
$450,000
Interest Rate
7.45%
Purchase Details
Closed on
May 29, 1996
Sold by
The Chicago Trust Company
Bought by
Marino Herman J
Create a Home Valuation Report for This Property
The Home Valuation Report is an in-depth analysis detailing your home's value as well as a comparison with similar homes in the area
Home Values in the Area
Average Home Value in this Area
Purchase History
| Date | Buyer | Sale Price | Title Company |
|---|---|---|---|
| Clarkson Matthew | $800,000 | None Available | |
| Jarrett Thomas M | $640,000 | -- | |
| Marino Herman J | -- | -- |
Source: Public Records
Mortgage History
| Date | Status | Borrower | Loan Amount |
|---|---|---|---|
| Open | Clarkson Matthew | $640,000 | |
| Previous Owner | Jarrett Thomas M | $450,000 |
Source: Public Records
Tax History
| Year | Tax Paid | Tax Assessment Tax Assessment Total Assessment is a certain percentage of the fair market value that is determined by local assessors to be the total taxable value of land and additions on the property. | Land | Improvement |
|---|---|---|---|---|
| 2024 | $17,938 | $306,920 | $131,766 | $175,154 |
| 2023 | $18,563 | $294,549 | $126,455 | $168,094 |
| 2022 | $18,563 | $315,049 | $154,110 | $160,939 |
| 2021 | $17,547 | $303,750 | $148,583 | $155,167 |
| 2020 | $17,093 | $304,390 | $148,896 | $155,494 |
| 2019 | $16,538 | $303,873 | $148,643 | $155,230 |
| 2018 | $9,140 | $332,867 | $157,550 | $175,317 |
| 2017 | $16,923 | $331,805 | $157,047 | $174,758 |
| 2016 | $16,404 | $319,258 | $151,108 | $168,150 |
| 2015 | $16,141 | $322,022 | $141,979 | $180,043 |
| 2014 | $13,275 | $250,729 | $142,995 | $107,734 |
| 2012 | $12,824 | $248,518 | $141,734 | $106,784 |
Source: Public Records
Map
Nearby Homes
- 1588 White Oak Rd
- 1190 W Old Mill Rd
- 1611 Wedgewood Dr
- 1454 Arcady Dr
- Lot 23 Wedgewood Dr
- Lot 24 Wedgewood Dr
- 1130 Lawrence Ave
- 1122 S Estate Ln
- 1959 Windridge Dr
- 1866 S Wilson Dr
- 5 Bridle Ln
- 11 Lakewood Dr
- 1371 Lakewood Dr
- 422 Old Mill Cir
- 14 Briarwood Ln
- 620 W Old Elm Rd
- 9 Ct of Connecticut River Valley
- 1315 Abington Cambs Dr
- 1485 Abington Cambs Dr
- 1161 Gavin Ct
- 1440 W Old Mill Rd
- 1570 Heritage Ct
- 1392 W Old Mill Rd
- 1540 Heritage Ct
- 1450 W Old Mill Rd
- 1641 Alexis Ct
- 1500 Heritage Ct
- 1385 W Old Mill Rd
- 1375 W Old Mill Rd
- 1490 Heritage Ct Unit 1
- 1630 Alexis Ct
- 1470 W Old Mill Rd
- 1310 W Old Mill Rd
- 1541 Heritage Ct
- 1491 Heritage Ct
- 1486 Heritage Ct
- 1489 Heritage Ct
- 1521 Heritage Ct
- 1515 Oak Knoll Dr
- 1671 Alexis Ct
Your Personal Tour Guide
Ask me questions while you tour the home.