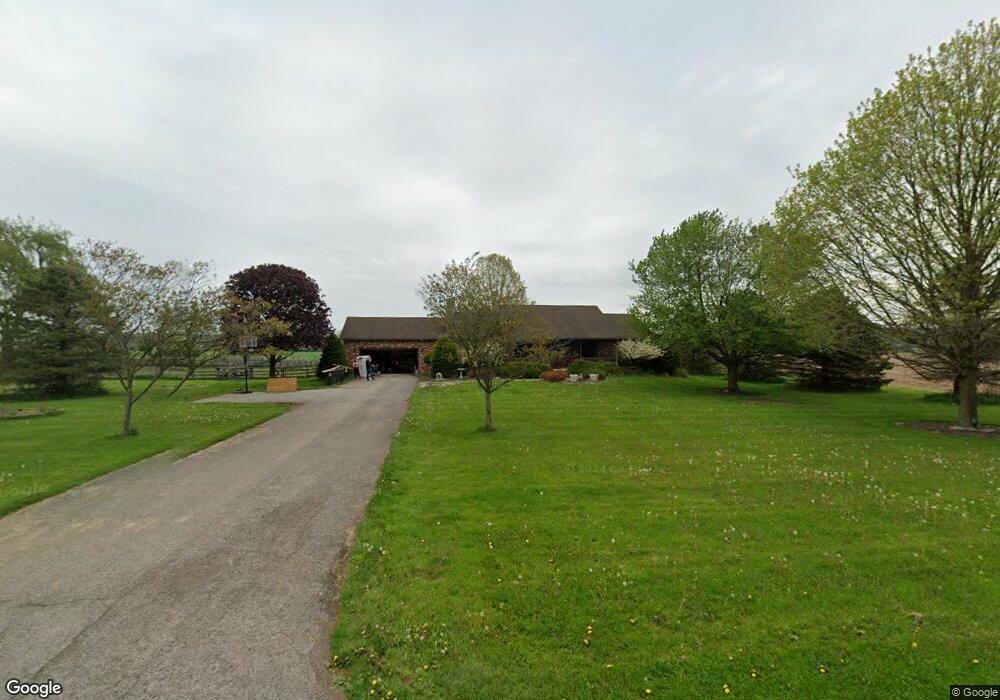
14100 Upper Fredericktown Rd Fredericktown, OH 43019
Estimated Value: $308,000 - $574,863
3
Beds
2
Baths
1,636
Sq Ft
$275/Sq Ft
Est. Value
About This Home
This home is located at 14100 Upper Fredericktown Rd, Fredericktown, OH 43019 and is currently estimated at $449,466, approximately $274 per square foot. 14100 Upper Fredericktown Rd is a home located in Knox County with nearby schools including Mount Vernon High School, St. Vincent de Paul School, and Ruscel Montessori Childrens House.
Ownership History
Date
Name
Owned For
Owner Type
Purchase Details
Closed on
Feb 21, 2024
Sold by
Knox County Teachers Fcu
Bought by
Nationstar Mortgage Llc
Current Estimated Value
Purchase Details
Closed on
Dec 6, 2013
Sold by
Rodgers William D and Rodgers Jennifer R
Bought by
Merz Ryan T
Home Financials for this Owner
Home Financials are based on the most recent Mortgage that was taken out on this home.
Original Mortgage
$240,562
Interest Rate
3.75%
Mortgage Type
FHA
Purchase Details
Closed on
Jun 25, 2009
Sold by
Borck Robert L and Borck Ala Faye
Bought by
Rodgers William D and Rodgers Jennifer R
Purchase Details
Closed on
May 11, 2000
Sold by
Borck Robert L and Ala Faye
Bought by
Borck Robert L and Ala Faye
Purchase Details
Closed on
Jan 12, 1990
Sold by
Rutan Sharon and Rutan Niggemeyer
Bought by
Borck Robert L and Ala Faye
Create a Home Valuation Report for This Property
The Home Valuation Report is an in-depth analysis detailing your home's value as well as a comparison with similar homes in the area
Purchase History
| Date | Buyer | Sale Price | Title Company |
|---|---|---|---|
| Nationstar Mortgage Llc | $325,100 | None Listed On Document | |
| Merz Ryan T | $183,750 | Title First Agency Inc | |
| Rodgers William D | $164,850 | None Available | |
| Borck Robert L | -- | -- | |
| Borck Robert L | $13,600 | -- |
Source: Public Records
Mortgage History
| Date | Status | Borrower | Loan Amount |
|---|---|---|---|
| Previous Owner | Merz Ryan T | $240,562 |
Source: Public Records
Tax History
| Year | Tax Paid | Tax Assessment Tax Assessment Total Assessment is a certain percentage of the fair market value that is determined by local assessors to be the total taxable value of land and additions on the property. | Land | Improvement |
|---|---|---|---|---|
| 2024 | $5,696 | $138,880 | $37,190 | $101,690 |
| 2023 | $5,709 | $138,870 | $37,180 | $101,690 |
| 2022 | $4,599 | $101,360 | $27,140 | $74,220 |
| 2021 | $4,599 | $101,360 | $27,140 | $74,220 |
| 2020 | $4,486 | $101,360 | $27,140 | $74,220 |
| 2019 | $4,057 | $85,080 | $24,300 | $60,780 |
| 2018 | $4,059 | $85,080 | $24,300 | $60,780 |
| 2017 | $3,993 | $85,080 | $24,300 | $60,780 |
| 2016 | $3,619 | $78,790 | $22,510 | $56,280 |
| 2015 | $3,634 | $78,790 | $22,510 | $56,280 |
| 2014 | $3,651 | $78,790 | $22,510 | $56,280 |
| 2013 | $3,569 | $71,590 | $20,140 | $51,450 |
Source: Public Records
Map
Nearby Homes
- 13919 Upper Fredericktown Rd
- 13683 Upper Fredericktown Rd
- 0 Crooked Street Land Split 2
- 0 Crooked St
- 13399 Old Mansfield Rd
- 13270 Rolling Hills Ct
- 14835 Indian Hills Rd
- 0 Indian Hills Rd
- 800 N Sandusky St
- 717 N Sandusky St
- 717 N Sandusky St Unit 14
- 10 Buena Vista Ave
- 1309 N Mulberry St
- 14281 N Liberty Rd
- 0 Upper Fredericktown Rd
- 18 Watson St
- 0 N Sandusky St
- 6 Adena Ct
- 305 Cooper St
- 301 Locust St
- 14097 Upper Fredericktown Rd
- 14097 Upper Fredericktown Rd
- 14200 Upper Fredericktown Rd
- 14047 Upper Fredericktown Rd
- 14107 Upper Fredericktown Rd
- 14.187 Acres Beckley Rd
- 14220 Upper Fredericktown Rd
- 14151 Upper Fredericktown Rd
- 13941 Upper Fredericktown Rd
- 14177 Upper Fredericktown Rd
- 13930 Beckley Rd
- 14280 Upper Fredericktown Rd
- 14281 Upper Fredericktown Rd
- 14340 Upper Fredericktown Rd
- 14319 Upper Fredericktown Rd
- 14369 Upper Fredericktown Rd
- 14428 Upper Fredericktown Rd
- 14421 Upper Fredericktown Rd
- 14458 Upper Fredericktown Rd
- 13557 Crooked St
Your Personal Tour Guide
Ask me questions while you tour the home.