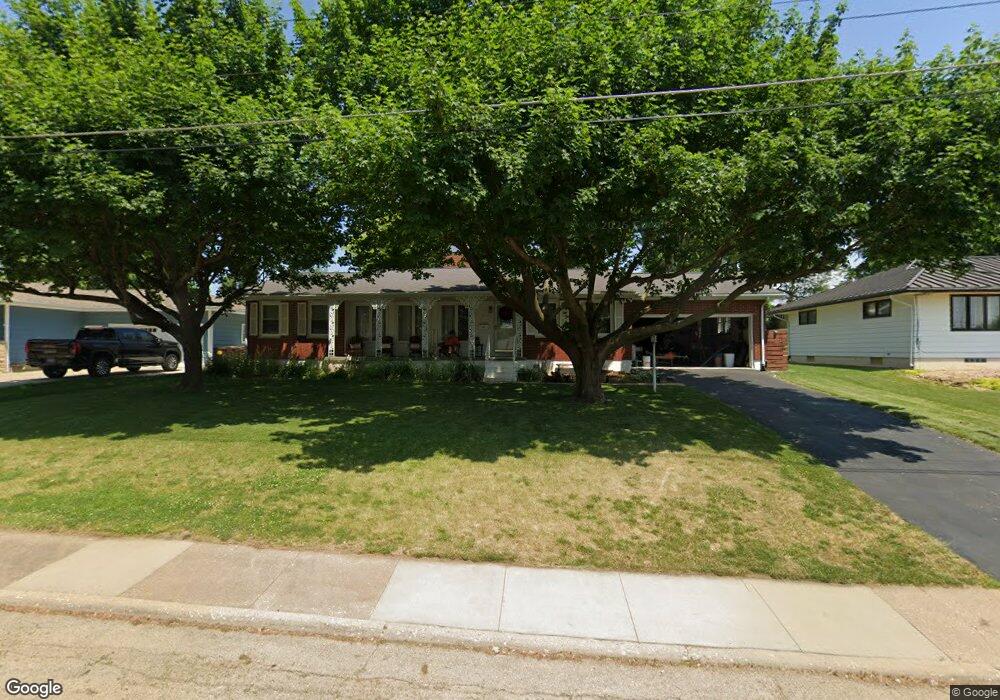
1411 9th Ave Fulton, IL 61252
Estimated Value: $191,000 - $217,000
3
Beds
2
Baths
1,730
Sq Ft
$117/Sq Ft
Est. Value
About This Home
This home is located at 1411 9th Ave, Fulton, IL 61252 and is currently estimated at $202,007, approximately $116 per square foot. 1411 9th Ave is a home located in Whiteside County with nearby schools including Fulton Elementary School, River Bend Middle School, and Fulton High School.
Ownership History
Date
Name
Owned For
Owner Type
Purchase Details
Closed on
Jul 28, 2022
Sold by
Revocable Living Trust
Bought by
Sweeney Michael A and Sweeney Jowl
Current Estimated Value
Home Financials for this Owner
Home Financials are based on the most recent Mortgage that was taken out on this home.
Original Mortgage
$126,750
Outstanding Balance
$121,407
Interest Rate
5.75%
Mortgage Type
VA
Estimated Equity
$80,600
Purchase Details
Closed on
Jun 26, 2014
Sold by
Merema Ryan C
Bought by
Merema Ryan C and Merema Stanley
Purchase Details
Closed on
Oct 31, 2011
Sold by
Merema Carrie L
Bought by
Merema Ryan C
Home Financials for this Owner
Home Financials are based on the most recent Mortgage that was taken out on this home.
Original Mortgage
$95,000
Interest Rate
3.97%
Mortgage Type
New Conventional
Purchase Details
Closed on
Jun 1, 2003
Bought by
Merema Ryan C
Create a Home Valuation Report for This Property
The Home Valuation Report is an in-depth analysis detailing your home's value as well as a comparison with similar homes in the area
Home Values in the Area
Average Home Value in this Area
Purchase History
| Date | Buyer | Sale Price | Title Company |
|---|---|---|---|
| Sweeney Michael A | $179,000 | Heid Nicholas W | |
| Merema Ryan C | -- | None Available | |
| Merema Ryan C | -- | None Available | |
| Merema Ryan C | -- | -- |
Source: Public Records
Mortgage History
| Date | Status | Borrower | Loan Amount |
|---|---|---|---|
| Open | Sweeney Michael A | $126,750 | |
| Previous Owner | Merema Ryan C | $95,000 |
Source: Public Records
Tax History Compared to Growth
Tax History
| Year | Tax Paid | Tax Assessment Tax Assessment Total Assessment is a certain percentage of the fair market value that is determined by local assessors to be the total taxable value of land and additions on the property. | Land | Improvement |
|---|---|---|---|---|
| 2024 | $3,887 | $54,489 | $6,443 | $48,046 |
| 2023 | $3,564 | $50,415 | $5,961 | $44,454 |
| 2022 | $3,345 | $46,222 | $5,465 | $40,757 |
| 2021 | $3,271 | $45,116 | $5,334 | $39,782 |
| 2020 | $3,399 | $46,699 | $5,521 | $41,178 |
| 2019 | $3,448 | $46,624 | $5,512 | $41,112 |
| 2018 | $3,278 | $45,297 | $5,355 | $39,942 |
| 2017 | $3,283 | $45,108 | $5,333 | $39,775 |
| 2016 | $3,214 | $44,102 | $5,214 | $38,888 |
| 2015 | $2,985 | $42,515 | $5,027 | $37,488 |
| 2014 | $304 | $43,016 | $5,086 | $37,930 |
| 2013 | $2,985 | $42,515 | $5,027 | $37,488 |
Source: Public Records
Map
Nearby Homes