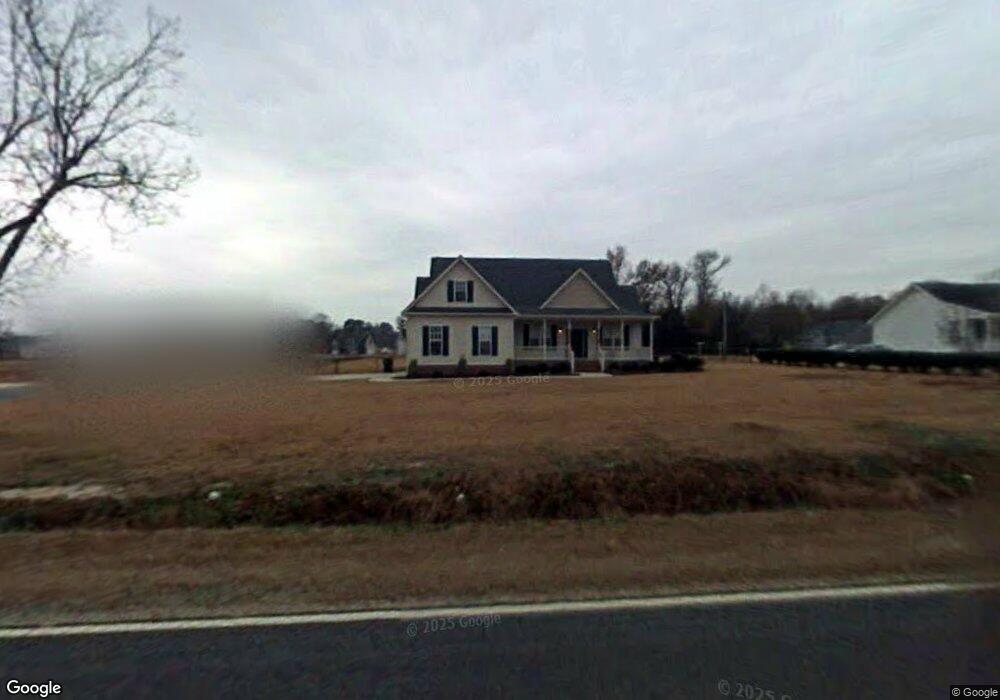
1411 Claridge Nursery Rd Goldsboro Out of Area, NC 27530
Estimated Value: $289,101 - $326,000
3
Beds
2
Baths
1,742
Sq Ft
$175/Sq Ft
Est. Value
About This Home
This home is located at 1411 Claridge Nursery Rd Goldsboro, Out of Area, NC 27530 and is currently estimated at $305,025, approximately $175 per square foot. 1411 Claridge Nursery Rd Goldsboro is a home located in Wayne County with nearby schools including Rosewood Elementary School, Rosewood Middle School, and Rosewood High School.
Ownership History
Date
Name
Owned For
Owner Type
Purchase Details
Closed on
Jun 22, 2010
Sold by
Scott James L
Bought by
Scott Mandy D
Current Estimated Value
Purchase Details
Closed on
Jun 15, 2009
Sold by
Plastow Michelle R and Miramontes Carlos S
Bought by
Scott James L and Scott Mandy D
Home Financials for this Owner
Home Financials are based on the most recent Mortgage that was taken out on this home.
Original Mortgage
$188,030
Outstanding Balance
$118,800
Interest Rate
4.77%
Mortgage Type
FHA
Estimated Equity
$186,225
Purchase Details
Closed on
Oct 28, 2005
Sold by
B R Stone Inc
Bought by
Miramontes Carlos S and Miramontes Michhelle R
Home Financials for this Owner
Home Financials are based on the most recent Mortgage that was taken out on this home.
Original Mortgage
$177,230
Interest Rate
5.5%
Mortgage Type
Adjustable Rate Mortgage/ARM
Create a Home Valuation Report for This Property
The Home Valuation Report is an in-depth analysis detailing your home's value as well as a comparison with similar homes in the area
Home Values in the Area
Average Home Value in this Area
Purchase History
| Date | Buyer | Sale Price | Title Company |
|---|---|---|---|
| Scott Mandy D | -- | None Available | |
| Scott James L | $192,000 | None Available | |
| Miramontes Carlos S | $173,500 | None Availabel |
Source: Public Records
Mortgage History
| Date | Status | Borrower | Loan Amount |
|---|---|---|---|
| Open | Scott James L | $188,030 | |
| Previous Owner | Miramontes Carlos S | $177,230 |
Source: Public Records
Tax History Compared to Growth
Tax History
| Year | Tax Paid | Tax Assessment Tax Assessment Total Assessment is a certain percentage of the fair market value that is determined by local assessors to be the total taxable value of land and additions on the property. | Land | Improvement |
|---|---|---|---|---|
| 2025 | $1,642 | $281,740 | $35,000 | $246,740 |
| 2024 | $1,642 | $191,770 | $22,000 | $169,770 |
| 2023 | $1,575 | $191,770 | $22,000 | $169,770 |
| 2022 | $1,575 | $191,770 | $22,000 | $169,770 |
| 2021 | $1,508 | $191,770 | $22,000 | $169,770 |
| 2020 | $1,423 | $191,770 | $22,000 | $169,770 |
| 2018 | $1,410 | $189,890 | $22,000 | $167,890 |
| 2017 | $1,410 | $189,890 | $22,000 | $167,890 |
| 2016 | $1,410 | $189,890 | $22,000 | $167,890 |
| 2015 | $1,413 | $189,890 | $22,000 | $167,890 |
| 2014 | -- | $189,890 | $22,000 | $167,890 |
Source: Public Records
Map
Nearby Homes
- 100 Village Grove Dr
- 103 John Deere Dr
- 0 N Carolina 581 Hwy
- 982 N Carolina 581
- 102 Stonewood Place
- 207 Stonewood Dr
- 104 Angel Place
- 103 Stonewood Place
- 0 Buck Swamp Unit 100521598
- 206 Stonewood Dr
- 401 Aarons Place
- 321 Aarons Place
- 313 Aarons Place
- 116 Aarons Run
- 111 Aarons Run
- 109 Aarons Run
- 105 Aarons Run
- 232 Mitchell Farm Rd
- 207 Millbrook Village Dr
- 206 Koufax Dr
- 1355 Claridge Nursery Rd
- 100 Addison Cir
- 1375 Claridge Nursery Rd
- 103 Addison Cir
- 1325 Claridge Nursery Rd
- 1385 Claridge Nursery Rd
- 102 Addison Cir
- 105 Addison Cir
- 104 Addison Cir
- 100 Penn Cir
- 106 Penn Cir
- 104 Penn Cir
- 102 Penn Cir
- 108 Penn Cir
- 106 Addison Cir
- 101 Penn Cir
- 101 Penn Cir
- 113 Penn Cir
- 103 Penn Cir
- 1345 Claridge Nursery Rd