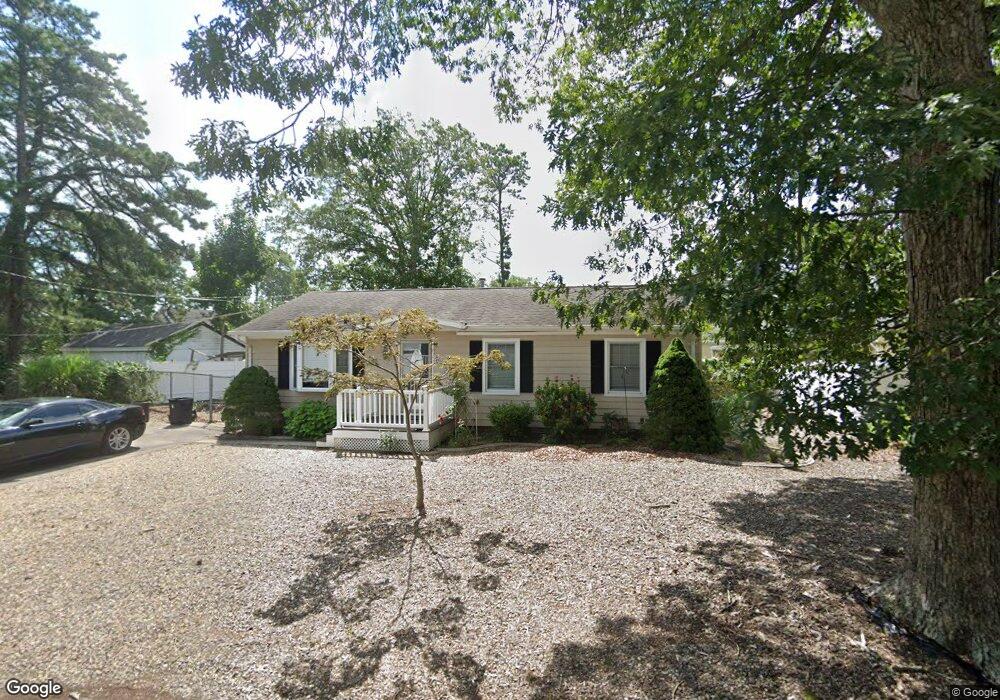
1411 Earie Way Forked River, NJ 08731
Lacey Township NeighborhoodEstimated Value: $347,000 - $402,000
3
Beds
1
Bath
1,008
Sq Ft
$374/Sq Ft
Est. Value
About This Home
This home is located at 1411 Earie Way, Forked River, NJ 08731 and is currently estimated at $376,796, approximately $373 per square foot. 1411 Earie Way is a home located in Ocean County with nearby schools including Lacey Township High School.
Ownership History
Date
Name
Owned For
Owner Type
Purchase Details
Closed on
Aug 2, 2012
Sold by
Kocses Fred and Kocses Janet
Bought by
Kocses Kimberly
Current Estimated Value
Home Financials for this Owner
Home Financials are based on the most recent Mortgage that was taken out on this home.
Original Mortgage
$179,591
Outstanding Balance
$124,412
Interest Rate
3.67%
Mortgage Type
New Conventional
Estimated Equity
$252,384
Purchase Details
Closed on
Nov 21, 2008
Sold by
Wheeler Marilynn
Bought by
Kocses Fred and Kocses Janet
Purchase Details
Closed on
Aug 16, 2000
Sold by
Vanduyne Robert
Bought by
Wheeler Marilyn
Home Financials for this Owner
Home Financials are based on the most recent Mortgage that was taken out on this home.
Original Mortgage
$108,896
Interest Rate
8%
Purchase Details
Closed on
Jul 1, 1998
Sold by
Brown Jeffrey Alan and Brown Carolyn Rose
Bought by
Vanduyne Robert E
Create a Home Valuation Report for This Property
The Home Valuation Report is an in-depth analysis detailing your home's value as well as a comparison with similar homes in the area
Home Values in the Area
Average Home Value in this Area
Purchase History
| Date | Buyer | Sale Price | Title Company |
|---|---|---|---|
| Kocses Kimberly | $176,000 | Zinn Title Agency Llc | |
| Kocses Fred | $165,000 | None Available | |
| Wheeler Marilyn | $115,000 | -- | |
| Vanduyne Robert E | $100,000 | -- |
Source: Public Records
Mortgage History
| Date | Status | Borrower | Loan Amount |
|---|---|---|---|
| Open | Kocses Kimberly | $179,591 | |
| Previous Owner | Wheeler Marilyn | $108,896 |
Source: Public Records
Tax History Compared to Growth
Tax History
| Year | Tax Paid | Tax Assessment Tax Assessment Total Assessment is a certain percentage of the fair market value that is determined by local assessors to be the total taxable value of land and additions on the property. | Land | Improvement |
|---|---|---|---|---|
| 2025 | $4,358 | $172,000 | $84,000 | $88,000 |
| 2024 | $4,075 | $172,000 | $84,000 | $88,000 |
| 2023 | $3,892 | $172,000 | $84,000 | $88,000 |
| 2022 | $3,892 | $172,000 | $84,000 | $88,000 |
| 2021 | $3,827 | $172,000 | $84,000 | $88,000 |
| 2020 | $3,705 | $172,000 | $84,000 | $88,000 |
| 2019 | $3,640 | $172,000 | $84,000 | $88,000 |
| 2018 | $3,597 | $172,000 | $84,000 | $88,000 |
| 2017 | $3,514 | $172,000 | $84,000 | $88,000 |
| 2016 | $3,508 | $172,400 | $84,000 | $88,400 |
| 2015 | $3,351 | $172,400 | $84,000 | $88,400 |
| 2014 | $3,547 | $206,200 | $124,000 | $82,200 |
Source: Public Records
Map
Nearby Homes
- 1515 Clair Rd
- 1427 Foch Ave
- 1409 Kay St
- 1533 Arient Rd
- 1316 Wood Ave
- 0000 Earie Way
- 483 Lake Barnegat Dr S
- 1445 Argonne Ave
- 501 Windsor St
- 1490 Earie Way
- 1223 Sylvania Place
- 503 Center St
- 576 Vaughn Ave
- 1988 Brookdale Dr
- 42 Canterbury Dr
- 000 Elwood St
- 605 Windsor St
- 1222 Taylor Ln
- 11 Portsmouth Dr
- 533 Chelsea St
- 1412 Earie Way
- 1419 Circle Dr
- 1417 Circle Dr
- 1403 Earie Way
- 1416 Circle Dr
- 1505 Beverly Rd
- 1414 Circle Dr
- 1410 Circle Dr
- 1416 Foch Ave
- 1418 Foch Ave
- 1413 Earie Way
- 1412 Foch Ave
- 1418 Earie Way
- 1404 Earie Way
- 1417 Lakeside Dr S
- 1411 Lakeside Dr S
- 1509 Beverly Rd
- 1515 Dee Rd
- 1502 Beverly Rd
- 1504 Whitcomb Rd