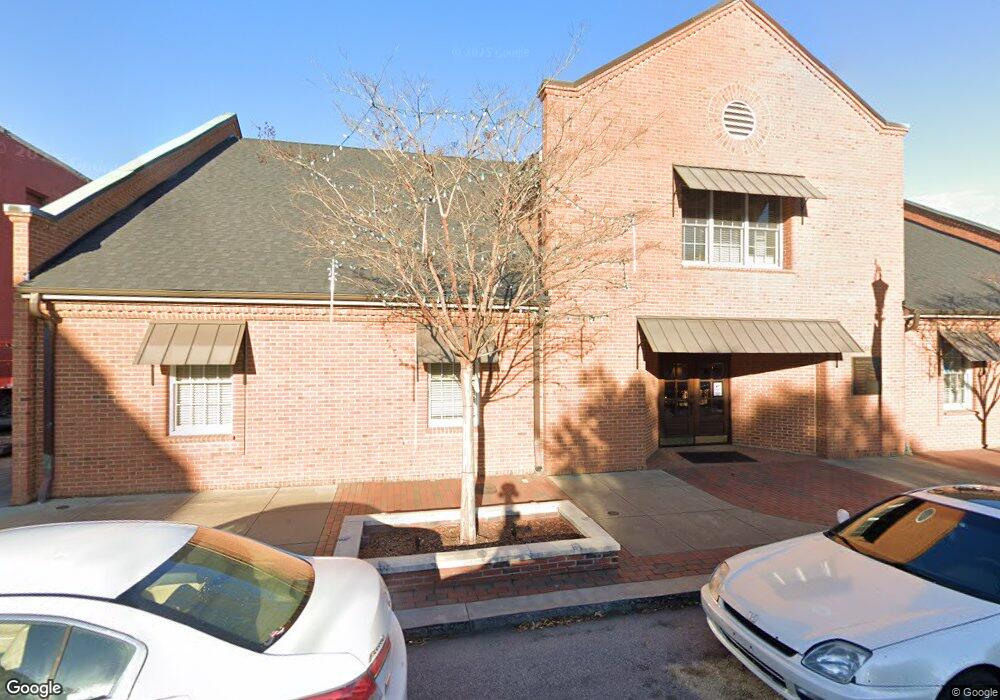
1411 Highway 378 Lexington, SC 29072
Estimated Value: $489,000 - $657,000
4
Beds
4
Baths
1,932
Sq Ft
$286/Sq Ft
Est. Value
About This Home
This home is located at 1411 Highway 378, Lexington, SC 29072 and is currently estimated at $552,532, approximately $285 per square foot. 1411 Highway 378 is a home located in Lexington County with nearby schools including Rocky Creek Elementary School, Beechwood Middle School, and Lexington High School.
Ownership History
Date
Name
Owned For
Owner Type
Purchase Details
Closed on
Feb 7, 2011
Sold by
Fannie Mae
Bought by
Nichols Richard and Nichols Jennifer
Current Estimated Value
Home Financials for this Owner
Home Financials are based on the most recent Mortgage that was taken out on this home.
Original Mortgage
$211,920
Outstanding Balance
$8,150
Interest Rate
4.76%
Mortgage Type
New Conventional
Estimated Equity
$544,382
Purchase Details
Closed on
Sep 2, 2010
Sold by
Weems William B and Weems Greer G
Bought by
Federal National Mortgage Association
Purchase Details
Closed on
Aug 6, 2008
Sold by
Weems Greer G
Bought by
Parks Diane P
Home Financials for this Owner
Home Financials are based on the most recent Mortgage that was taken out on this home.
Original Mortgage
$60,950
Interest Rate
6.32%
Mortgage Type
Unknown
Purchase Details
Closed on
Feb 26, 1999
Sold by
Summer Steve R
Bought by
Weems William B
Create a Home Valuation Report for This Property
The Home Valuation Report is an in-depth analysis detailing your home's value as well as a comparison with similar homes in the area
Home Values in the Area
Average Home Value in this Area
Purchase History
| Date | Buyer | Sale Price | Title Company |
|---|---|---|---|
| Nichols Richard | $264,900 | -- | |
| Federal National Mortgage Association | $2,500 | -- | |
| Parks Diane P | -- | -- | |
| Weems William B | $89,400 | -- |
Source: Public Records
Mortgage History
| Date | Status | Borrower | Loan Amount |
|---|---|---|---|
| Open | Nichols Richard | $211,920 | |
| Previous Owner | Parks Diane P | $60,950 |
Source: Public Records
Tax History Compared to Growth
Tax History
| Year | Tax Paid | Tax Assessment Tax Assessment Total Assessment is a certain percentage of the fair market value that is determined by local assessors to be the total taxable value of land and additions on the property. | Land | Improvement |
|---|---|---|---|---|
| 2024 | $1,906 | $13,953 | $833 | $13,120 |
| 2023 | $2,093 | $8,317 | $827 | $7,490 |
| 2022 | $836 | $8,317 | $827 | $7,490 |
| 2020 | $866 | $8,317 | $827 | $7,490 |
| 2019 | $850 | $8,099 | $827 | $7,272 |
| 2018 | $836 | $8,099 | $827 | $7,272 |
| 2017 | $803 | $8,099 | $827 | $7,272 |
| 2016 | $805 | $8,099 | $827 | $7,272 |
| 2015 | $767 | $8,099 | $827 | $7,272 |
| 2014 | $817 | $8,467 | $827 | $7,640 |
| 2013 | -- | $8,470 | $830 | $7,640 |
Source: Public Records
Map
Nearby Homes
- 182 Beechwoods Dr
- 233 Welsummer Way
- 554 Treehouse Ln
- 217 Lightning Bug Ln
- 304 Lightning Bug Ln
- 0 Counts Ferry Lot 3 Rd
- 0 Counts Ferry Lot 5 Rd
- 720 Braekel Ct
- 370 Lightning Bug Ln
- 216 Bantam Place
- 104 Dandelion Ct
- 212 Bantam Place
- 215 Clubside Dr
- 112 Feather Site Ln
- 146 Clubside Dr
- 142 Clubside Dr
- 213 Phoenix Ct
- 138 Clubside Dr
- 134 Clubside Dr
- 130 Clubside Dr
- 1411 Hwy 378
- 1411 Highway 378
- 1419 Highway 378 W
- 249 Calks Ferry Rd
- 119 Beechwoods Dr
- 118 Beechwoods Dr
- 305 Calks Ferry Rd
- 305 Calks Ferry Rd
- 251 Calks Ferry Rd
- 125 Beechwoods Dr
- 129 Beechwoods Dr
- 231 Calks Ferry Rd
- 130 Beechwoods Dr
- 253 Calks Ferry Rd
- 237 Calks Ferry Rd
- 137 Beechwoods Dr
- 135 Beechwoods Dr
- 1341 Highway 378
- 311 Calks Ferry Rd
- 311 Calks Ferry Rd