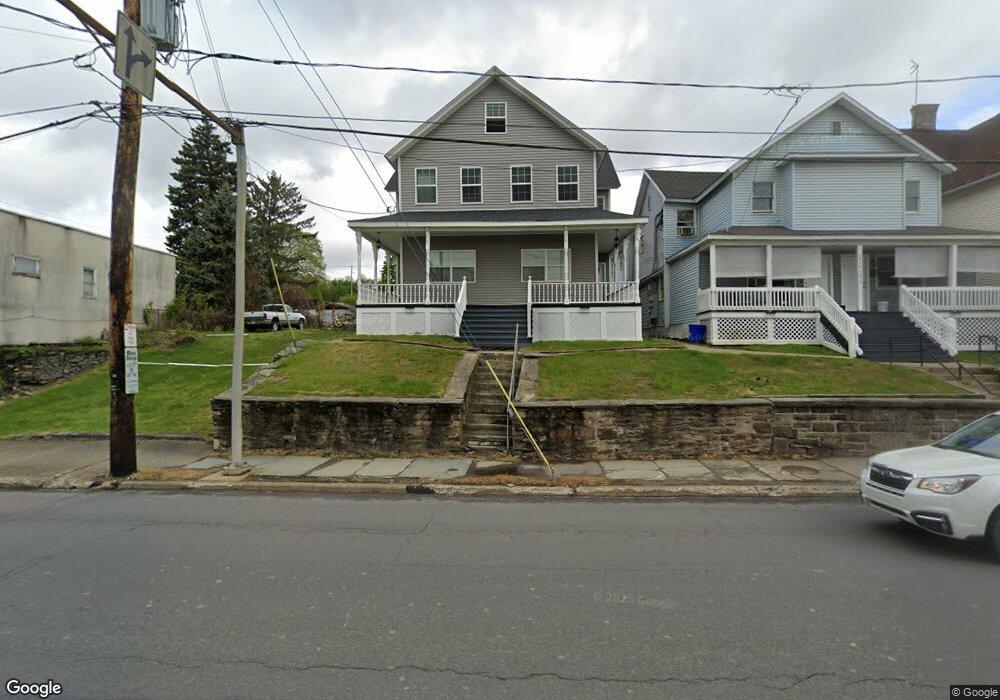
1411 N Main Ave Unit 1413 Scranton, PA 18508
Tripp's Park NeighborhoodEstimated Value: $144,000 - $261,000
--
Bed
--
Bath
2,540
Sq Ft
$79/Sq Ft
Est. Value
About This Home
This home is located at 1411 N Main Ave Unit 1413, Scranton, PA 18508 and is currently estimated at $201,096, approximately $79 per square foot. 1411 N Main Ave Unit 1413 is a home located in Lackawanna County with nearby schools including Neil Armstrong Elementary School, Scranton High School, and St Clare/St Paul School.
Ownership History
Date
Name
Owned For
Owner Type
Purchase Details
Closed on
Jul 2, 2010
Sold by
Pribysh Nataliya and Pribysh Boris
Bought by
Us Bank National Association
Current Estimated Value
Purchase Details
Closed on
Apr 13, 2006
Sold by
Wideman Danielle
Bought by
Pribysh Boris and Pribysh Nataliya
Home Financials for this Owner
Home Financials are based on the most recent Mortgage that was taken out on this home.
Original Mortgage
$79,920
Interest Rate
6.4%
Mortgage Type
Commercial
Purchase Details
Closed on
Aug 31, 2005
Sold by
Miller Robert W and Wideman Danielle
Bought by
Wideman Danielle
Home Financials for this Owner
Home Financials are based on the most recent Mortgage that was taken out on this home.
Original Mortgage
$48,545
Interest Rate
5.79%
Mortgage Type
Commercial
Create a Home Valuation Report for This Property
The Home Valuation Report is an in-depth analysis detailing your home's value as well as a comparison with similar homes in the area
Home Values in the Area
Average Home Value in this Area
Purchase History
| Date | Buyer | Sale Price | Title Company |
|---|---|---|---|
| Us Bank National Association | $3,818 | None Available | |
| Pribysh Boris | $99,900 | None Available | |
| Wideman Danielle | -- | None Available |
Source: Public Records
Mortgage History
| Date | Status | Borrower | Loan Amount |
|---|---|---|---|
| Previous Owner | Pribysh Boris | $79,920 | |
| Previous Owner | Wideman Danielle | $48,545 |
Source: Public Records
Tax History Compared to Growth
Tax History
| Year | Tax Paid | Tax Assessment Tax Assessment Total Assessment is a certain percentage of the fair market value that is determined by local assessors to be the total taxable value of land and additions on the property. | Land | Improvement |
|---|---|---|---|---|
| 2025 | $3,775 | $11,000 | $2,950 | $8,050 |
| 2024 | $3,465 | $11,000 | $2,950 | $8,050 |
| 2023 | $3,465 | $11,000 | $2,950 | $8,050 |
| 2022 | $3,390 | $11,000 | $2,950 | $8,050 |
| 2021 | $3,390 | $11,000 | $2,950 | $8,050 |
| 2020 | $3,331 | $11,000 | $2,950 | $8,050 |
| 2019 | $3,138 | $11,000 | $2,950 | $8,050 |
| 2018 | $3,138 | $11,000 | $2,950 | $8,050 |
| 2017 | $3,086 | $11,000 | $2,950 | $8,050 |
| 2016 | $0 | $11,000 | $2,950 | $8,050 |
| 2015 | $2,358 | $11,000 | $2,950 | $8,050 |
| 2014 | -- | $11,000 | $2,950 | $8,050 |
Source: Public Records
Map
Nearby Homes
- 1436 Church Ave
- 1430 N Main Ave
- 1012 Clearview St
- 1311 Short Ave
- 656 Philo St
- 0 Philo St Unit GSBSC4763
- 1227 Providence Rd
- 1235 N Sumner Ave
- 1402 N Rebecca Ave
- 1123 Court St
- 18 Green Ridge St
- 117 Ferdinand St
- 1537 Gardner Ave
- 1206 Blair Ave Unit Rear
- 231 Putnam St
- 1711 N Sumner Ave
- 1513 Meylert Ave
- 1515-1517 Brick Ave
- 1729 Wayne Ave
- 401 Putnam St
- 1411 N Main Ave
- 1415 N Main Ave Unit 1417
- 1415 N Main Ave
- 1419 N Main Ave
- 1403 N Main Ave
- 1423 N Main Ave
- 1357 N Main Ave
- 1357 N Main Ave Unit 2nd floor
- 1425 N Main Ave
- 1427-1429 N Main St Ave
- 1427 N Main St
- 1427-1429 N Main Ave
- 1427 N Main Ave Unit 1429
- 1406 N Main Ave
- 1422 Church Ave
- 1410-1412 Church Ave
- 1355 N Main Ave
- 1424 Church Ave
- 1414 N Main Ave
- 1112 Wood St