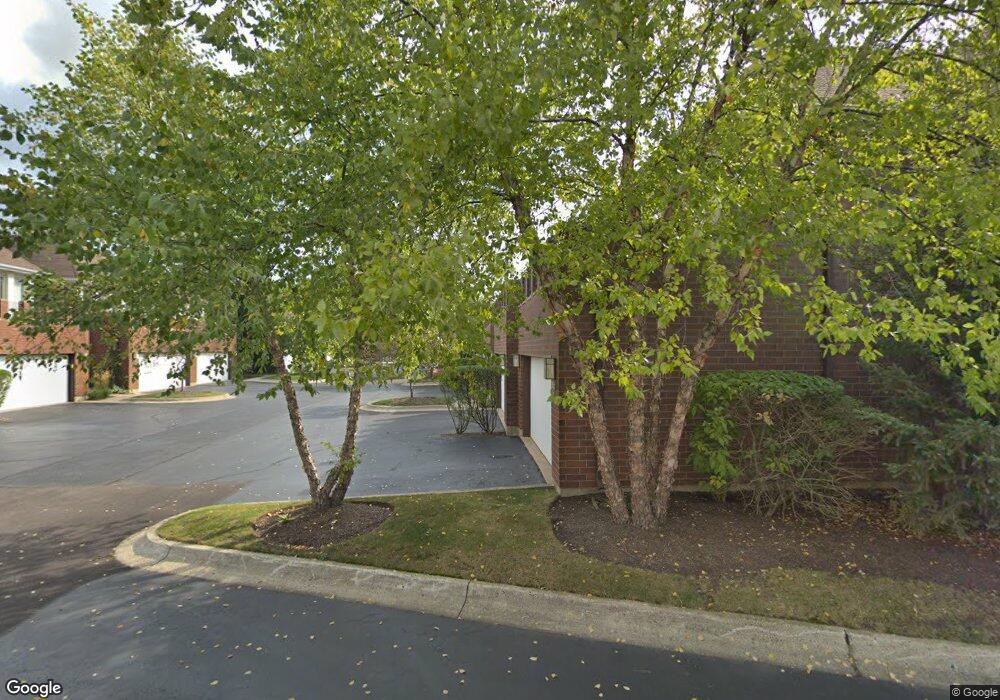
1411 N Milwaukee Ave Unit 1411 Libertyville, IL 60048
Estimated Value: $422,000 - $542,000
--
Bed
3
Baths
1,700
Sq Ft
$291/Sq Ft
Est. Value
About This Home
This home is located at 1411 N Milwaukee Ave Unit 1411, Libertyville, IL 60048 and is currently estimated at $494,143, approximately $290 per square foot. 1411 N Milwaukee Ave Unit 1411 is a home located in Lake County with nearby schools including Adler Park School, Highland Middle School, and Libertyville High School.
Ownership History
Date
Name
Owned For
Owner Type
Purchase Details
Closed on
Oct 28, 2016
Sold by
Coleman Lindsay B
Bought by
Coleman Lindsay B and Lindsey B Coleman Trus
Current Estimated Value
Purchase Details
Closed on
Aug 15, 2007
Sold by
The Investment Team Llc
Bought by
Coleman Lindsay B
Home Financials for this Owner
Home Financials are based on the most recent Mortgage that was taken out on this home.
Original Mortgage
$336,000
Outstanding Balance
$214,148
Interest Rate
6.79%
Mortgage Type
Unknown
Estimated Equity
$279,995
Purchase Details
Closed on
Jun 11, 2007
Sold by
Koya Panduranga R
Bought by
The Investment Team Llc
Purchase Details
Closed on
Jun 9, 2003
Sold by
Wasserman Carl and Wasserman Joann B
Bought by
Koya Panduranga R
Home Financials for this Owner
Home Financials are based on the most recent Mortgage that was taken out on this home.
Original Mortgage
$322,700
Interest Rate
4.62%
Mortgage Type
Unknown
Create a Home Valuation Report for This Property
The Home Valuation Report is an in-depth analysis detailing your home's value as well as a comparison with similar homes in the area
Home Values in the Area
Average Home Value in this Area
Purchase History
| Date | Buyer | Sale Price | Title Company |
|---|---|---|---|
| Coleman Lindsay B | -- | Attorney | |
| Coleman Lindsay B | $420,000 | First American Title Ins Co | |
| The Investment Team Llc | $365,000 | None Available | |
| Koya Panduranga R | $362,000 | Ticor Title Insurance Compan |
Source: Public Records
Mortgage History
| Date | Status | Borrower | Loan Amount |
|---|---|---|---|
| Open | Coleman Lindsay B | $336,000 | |
| Previous Owner | Koya Panduranga R | $322,700 |
Source: Public Records
Tax History Compared to Growth
Tax History
| Year | Tax Paid | Tax Assessment Tax Assessment Total Assessment is a certain percentage of the fair market value that is determined by local assessors to be the total taxable value of land and additions on the property. | Land | Improvement |
|---|---|---|---|---|
| 2024 | $9,912 | $142,119 | $32,327 | $109,792 |
| 2023 | $9,318 | $131,081 | $29,816 | $101,265 |
| 2022 | $9,318 | $122,507 | $28,658 | $93,849 |
| 2021 | $8,968 | $119,870 | $28,041 | $91,829 |
| 2020 | $8,629 | $117,855 | $27,570 | $90,285 |
| 2019 | $8,704 | $120,550 | $27,308 | $93,242 |
| 2018 | $8,366 | $119,917 | $27,162 | $92,755 |
| 2017 | $8,247 | $116,131 | $26,304 | $89,827 |
| 2016 | $7,967 | $110,108 | $24,940 | $85,168 |
| 2015 | $7,886 | $102,915 | $23,311 | $79,604 |
| 2014 | $6,450 | $85,000 | $17,641 | $67,359 |
| 2012 | $5,851 | $81,656 | $16,948 | $64,708 |
Source: Public Records
Map
Nearby Homes
- 31132-31140 N Milwaukee Ave
- 1211 Parliament Ct
- 204 W Ellis Ave
- 208 W Ellis Ave
- 616 Parkside Ct
- 212 W Ellis Ave
- 662 Parkside Ct
- 694 Parkside Ct
- 619 Parkside Ct
- 922 N Milwaukee Ave Unit A
- 1935 Lynn Cir
- 16108 W Des Plaines Dr
- 16051 W Des Plaines Dr
- 224 Newberry Ave
- 505 Lange Ct
- 420 W Cook Ave
- 1512 Sunnyview Rd
- 212 Elm Ct
- 217 E Church St
- 832 Interlaken Ln
- 1413 N Milwaukee Ave Unit 1413
- 1415 N Milwaukee Ave Unit 1415
- 1417 N Milwaukee Ave Unit 1417
- 1449 N Milwaukee Ave Unit 1449
- 1447 N Milwaukee Ave Unit 1447
- 1443 N Milwaukee Ave Unit 1443
- 1441 N Milwaukee Ave
- 1445 N Milwaukee Ave Unit 1445
- 1445 N Milwaukee Ave
- 1451 N Milwaukee Ave Unit 1451
- 1453 N Milwaukee Ave Unit 1453
- 1423 N Milwaukee Ave Unit 1423
- 1423 N Milwaukee Ave
- 1425 N Milwaukee Ave Unit 1425
- 1455 N Milwaukee Ave Unit 1455
- 1421 N Milwaukee Ave Unit 1421
- 1427 N Milwaukee Ave Unit 1427
- 1457 N Milwaukee Ave Unit 1457
- 1431 N Milwaukee Ave
- 1433 N Milwaukee Ave Unit 1433