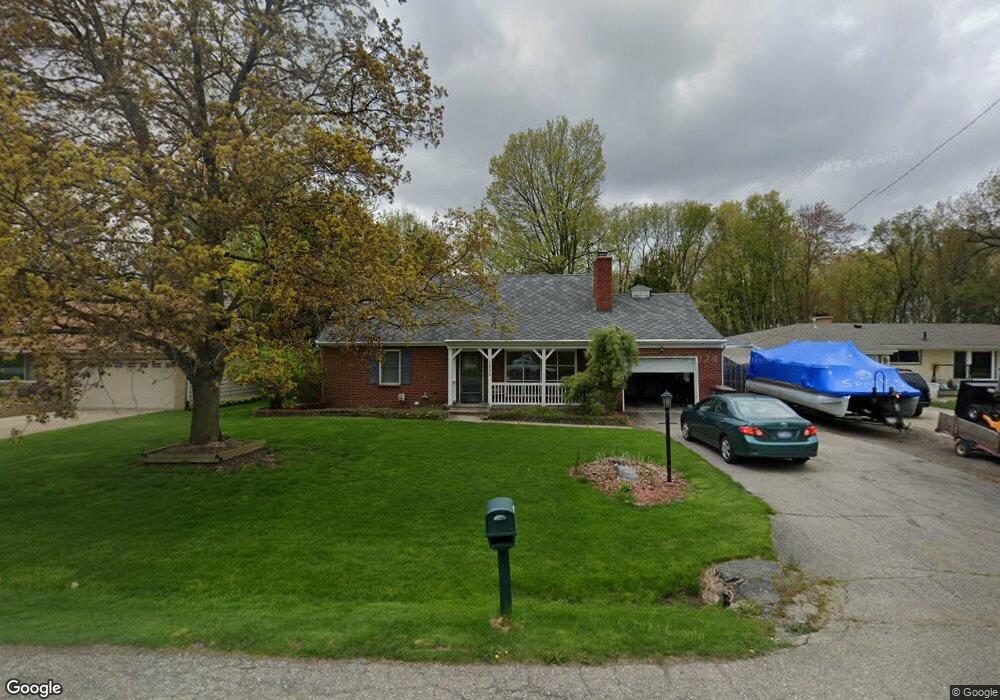
1411 Shaffer Ct Lansing, MI 48917
Edgemont Park NeighborhoodEstimated Value: $224,000 - $260,000
3
Beds
2
Baths
1,653
Sq Ft
$149/Sq Ft
Est. Value
About This Home
This home is located at 1411 Shaffer Ct, Lansing, MI 48917 and is currently estimated at $246,660, approximately $149 per square foot. 1411 Shaffer Ct is a home located in Ingham County with nearby schools including Waverly Senior High School, Mid-Michigan Leadership Academy, and Windemere Park Charter Academy.
Ownership History
Date
Name
Owned For
Owner Type
Purchase Details
Closed on
May 9, 2003
Sold by
Gribben Mark C and Gribben Susan
Bought by
Gray Gerard M
Current Estimated Value
Purchase Details
Closed on
Sep 1, 1995
Sold by
Barribeau Roland F and Barribeau Laurel A
Bought by
Gribben Mark C and Gribben Susan
Create a Home Valuation Report for This Property
The Home Valuation Report is an in-depth analysis detailing your home's value as well as a comparison with similar homes in the area
Home Values in the Area
Average Home Value in this Area
Purchase History
| Date | Buyer | Sale Price | Title Company |
|---|---|---|---|
| Gray Gerard M | $155,000 | Transnation | |
| Gribben Mark C | $115,000 | -- |
Source: Public Records
Tax History Compared to Growth
Tax History
| Year | Tax Paid | Tax Assessment Tax Assessment Total Assessment is a certain percentage of the fair market value that is determined by local assessors to be the total taxable value of land and additions on the property. | Land | Improvement |
|---|---|---|---|---|
| 2025 | $4,377 | $117,700 | $34,000 | $83,700 |
| 2024 | $4,241 | $109,800 | $27,500 | $82,300 |
| 2023 | $4,241 | $96,100 | $27,500 | $68,600 |
| 2022 | $4,055 | $85,200 | $25,200 | $60,000 |
| 2021 | $4,071 | $81,100 | $22,200 | $58,900 |
| 2020 | $3,781 | $79,000 | $22,200 | $56,800 |
| 2019 | $3,698 | $74,700 | $16,100 | $58,600 |
| 2018 | $3,705 | $70,800 | $11,300 | $59,500 |
| 2017 | $3,476 | $70,800 | $11,300 | $59,500 |
| 2016 | -- | $64,400 | $10,300 | $54,100 |
| 2015 | -- | $62,700 | $20,625 | $42,075 |
| 2014 | -- | $58,900 | $20,625 | $38,275 |
Source: Public Records
Map
Nearby Homes
- 1610 Ravenswood Dr
- 1920 Briarwood Dr
- 1222 Ravenswood Dr
- 3502 Springbrook Ln
- 3322 Pickwick Place
- 1805 Boynton Dr
- 3333 W Willow St
- 3316 W Willow St
- 3435 Hagan St
- 3014 Timber Dr
- 3001 Risley Dr
- 4320 Mar Moor Dr
- 2817 W Willow St
- 2206 Kuerbitz Dr
- 3733 Colchester Rd
- 2123 Cogswell Dr
- 2300 Byrnes Rd
- 0 San Gabriel
- 3500 Colchester Rd
- 2524 Newport Dr
- 1405 Shaffer Ct
- 1421 Shaffer Ct
- 1325 Shaffer Ct
- 1319 Shaffer Ct
- 1410 Shaffer Ct
- 1427 Shaffer Ct
- 1400 Shaffer Ct
- 1426 Shaffer Ct
- 1322 Shaffer Ct
- 1318 Shaffer Ct
- 1307 Shaffer Ct
- 3712 W Willow St
- 3726 W Willow St
- 0 Keegan Ct
- 1415 Ravenswood Dr
- 1411 Ravenswood Dr
- 1327 Ravenswood Dr
- 3705 Springbrook Ln
- 3711 Springbrook Ln
- 1421 Ravenswood Dr