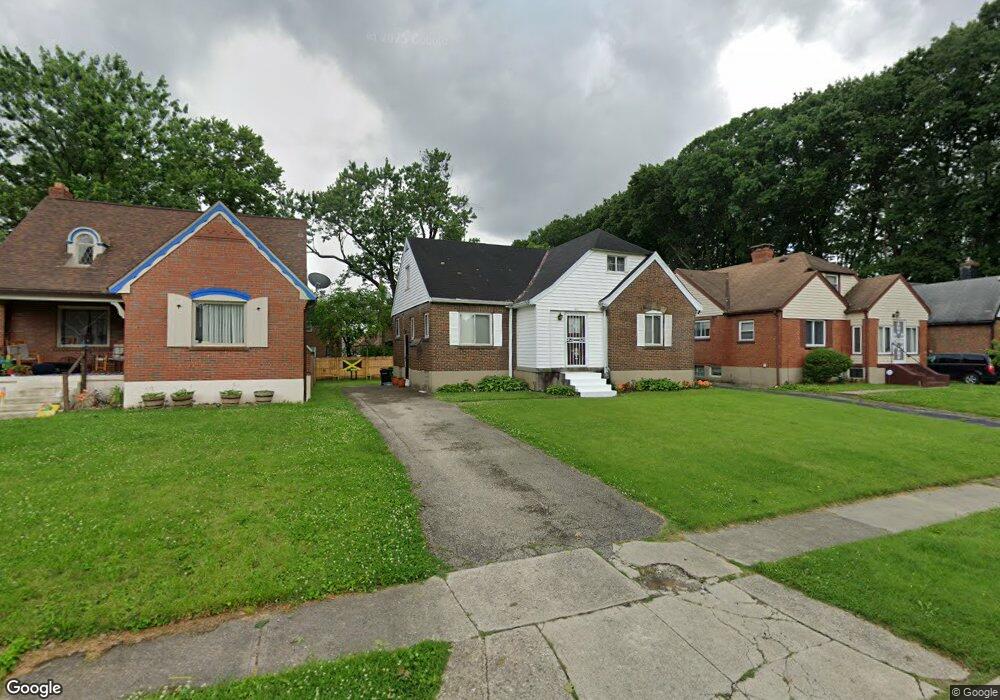
1411 Shenandoah Ave Cincinnati, OH 45237
Roselawn NeighborhoodEstimated Value: $221,219 - $275,000
4
Beds
3
Baths
1,153
Sq Ft
$208/Sq Ft
Est. Value
About This Home
This home is located at 1411 Shenandoah Ave, Cincinnati, OH 45237 and is currently estimated at $239,805, approximately $207 per square foot. 1411 Shenandoah Ave is a home located in Hamilton County with nearby schools including Roselawn Condon School, Shroder High School, and Clark Montessori High School.
Ownership History
Date
Name
Owned For
Owner Type
Purchase Details
Closed on
Apr 24, 2004
Sold by
Stearns Wade C and Stearns Janice F
Bought by
Bogle Sandra E
Current Estimated Value
Home Financials for this Owner
Home Financials are based on the most recent Mortgage that was taken out on this home.
Original Mortgage
$111,453
Outstanding Balance
$52,339
Interest Rate
5.63%
Mortgage Type
Unknown
Estimated Equity
$187,466
Purchase Details
Closed on
Jan 27, 2003
Sold by
Edwards Janice F and Edwards Janice F
Bought by
Stearns Wade C and Stearns Janice F
Purchase Details
Closed on
Dec 29, 1995
Sold by
Kandelson Mildred
Bought by
Edwards Janice F
Home Financials for this Owner
Home Financials are based on the most recent Mortgage that was taken out on this home.
Original Mortgage
$83,436
Interest Rate
7.41%
Mortgage Type
FHA
Create a Home Valuation Report for This Property
The Home Valuation Report is an in-depth analysis detailing your home's value as well as a comparison with similar homes in the area
Home Values in the Area
Average Home Value in this Area
Purchase History
| Date | Buyer | Sale Price | Title Company |
|---|---|---|---|
| Bogle Sandra E | $114,500 | -- | |
| Stearns Wade C | -- | -- | |
| Edwards Janice F | -- | -- |
Source: Public Records
Mortgage History
| Date | Status | Borrower | Loan Amount |
|---|---|---|---|
| Open | Bogle Sandra E | $111,453 | |
| Previous Owner | Edwards Janice F | $83,436 |
Source: Public Records
Tax History Compared to Growth
Tax History
| Year | Tax Paid | Tax Assessment Tax Assessment Total Assessment is a certain percentage of the fair market value that is determined by local assessors to be the total taxable value of land and additions on the property. | Land | Improvement |
|---|---|---|---|---|
| 2024 | $3,165 | $51,083 | $8,635 | $42,448 |
| 2023 | $3,161 | $51,083 | $8,635 | $42,448 |
| 2022 | $2,091 | $30,059 | $7,543 | $22,516 |
| 2021 | $2,011 | $30,059 | $7,543 | $22,516 |
| 2020 | $2,071 | $30,059 | $7,543 | $22,516 |
| 2019 | $2,077 | $27,577 | $6,920 | $20,657 |
| 2018 | $2,080 | $27,577 | $6,920 | $20,657 |
| 2017 | $1,975 | $27,577 | $6,920 | $20,657 |
| 2016 | $2,028 | $27,952 | $7,060 | $20,892 |
| 2015 | $1,833 | $27,952 | $7,060 | $20,892 |
| 2014 | $1,843 | $27,952 | $7,060 | $20,892 |
| 2013 | $1,838 | $27,402 | $6,920 | $20,482 |
Source: Public Records
Map
Nearby Homes
- 1373 Section Rd
- 1519 Section Rd
- 7247 Reading Rd
- 1551 Kenova Ave
- 1614 Miramar Ct
- 1623 Summit Rd
- 1627 Summit Rd
- 7139 Eastlawn Dr
- 119 Nansen St
- 7755 Newbedford Ave
- 1604 Crest Hill Ave
- 7110 Eastlawn Dr
- 7100 Eastlawn Dr
- 7072 Eastlawn Dr
- 7792 Stillwell Rd
- 1931 Seymour Ave
- 7866 Greenland Place
- 7871 Glenorchard Dr
- 7901 Glenorchard Dr
- 6770 Elbrook Ave
- 1415 Shenandoah Ave
- 1407 Shenandoah Ave
- 1403 Shenandoah Ave
- 1419 Shenandoah Ave
- 1410 Corvallis Ave
- 1414 Corvallis Ave
- 1406 Corvallis Ave
- 1418 Corvallis Ave
- 1423 Shenandoah Ave
- 1402 Corvallis Ave
- 1410 Shenandoah Ave
- 1422 Corvallis Ave
- 1406 Shenandoah Ave
- 1414 Shenandoah Ave
- 1402 Shenandoah Ave
- 1427 Shenandoah Ave
- 1426 Corvallis Ave
- 1422 Shenandoah Ave
- 1430 Corvallis Ave
- 1431 Shenandoah Ave