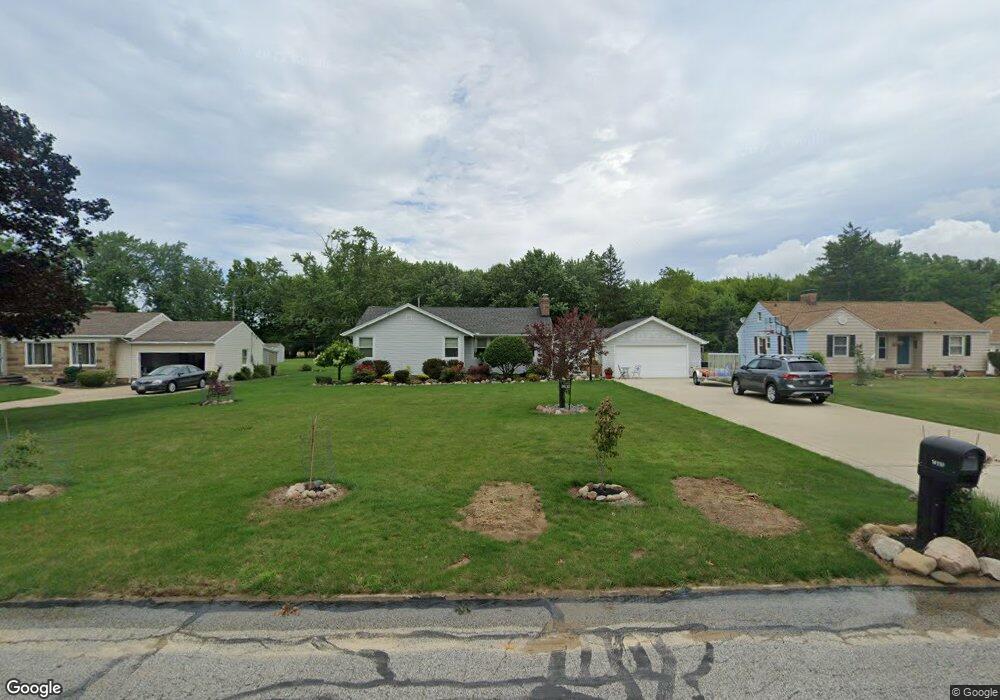
14110 Shawnee Trail Middleburg Heights, OH 44130
Estimated Value: $244,435 - $274,000
2
Beds
2
Baths
1,239
Sq Ft
$209/Sq Ft
Est. Value
About This Home
This home is located at 14110 Shawnee Trail, Middleburg Heights, OH 44130 and is currently estimated at $259,359, approximately $209 per square foot. 14110 Shawnee Trail is a home located in Cuyahoga County with nearby schools including Big Creek Elementary School, Berea-Midpark Middle School, and Berea-Midpark High School.
Ownership History
Date
Name
Owned For
Owner Type
Purchase Details
Closed on
Oct 15, 2015
Sold by
Preiszig Jane F and Preiszig Paul
Bought by
Preiszig Paul J and Preiszig Jessica M
Current Estimated Value
Home Financials for this Owner
Home Financials are based on the most recent Mortgage that was taken out on this home.
Original Mortgage
$127,500
Outstanding Balance
$100,316
Interest Rate
3.88%
Mortgage Type
Purchase Money Mortgage
Estimated Equity
$159,043
Purchase Details
Closed on
May 10, 2001
Sold by
Horejsei Lenore
Bought by
Preiszig Jane F
Purchase Details
Closed on
Aug 21, 1999
Sold by
Horejsei Joseph J
Bought by
Preiszig Jane F and Horejsei Lenore
Purchase Details
Closed on
Dec 23, 1976
Sold by
Horejsei Jos J and Horejsei Malvina
Bought by
Horejsei Joseph J
Purchase Details
Closed on
Jan 1, 1975
Bought by
Horejsei Jos J and Horejsei Malvina
Create a Home Valuation Report for This Property
The Home Valuation Report is an in-depth analysis detailing your home's value as well as a comparison with similar homes in the area
Home Values in the Area
Average Home Value in this Area
Purchase History
| Date | Buyer | Sale Price | Title Company |
|---|---|---|---|
| Preiszig Paul J | $150,000 | Guardian Title & Guaran | |
| Preiszig Jane F | $50,000 | -- | |
| Preiszig Jane F | -- | -- | |
| Horejsei Joseph J | -- | -- | |
| Horejsei Joseph J | -- | -- | |
| Horejsei Jos J | -- | -- |
Source: Public Records
Mortgage History
| Date | Status | Borrower | Loan Amount |
|---|---|---|---|
| Open | Preiszig Paul J | $127,500 |
Source: Public Records
Tax History Compared to Growth
Tax History
| Year | Tax Paid | Tax Assessment Tax Assessment Total Assessment is a certain percentage of the fair market value that is determined by local assessors to be the total taxable value of land and additions on the property. | Land | Improvement |
|---|---|---|---|---|
| 2024 | $4,359 | $81,060 | $35,105 | $45,955 |
| 2023 | $4,667 | $72,070 | $16,590 | $55,480 |
| 2022 | $4,636 | $72,070 | $16,590 | $55,480 |
| 2021 | $4,611 | $72,070 | $16,590 | $55,480 |
| 2020 | $4,520 | $62,130 | $14,320 | $47,810 |
| 2019 | $4,394 | $177,500 | $40,900 | $136,600 |
| 2018 | $4,314 | $61,180 | $14,320 | $46,870 |
| 2017 | $4,289 | $56,150 | $14,670 | $41,480 |
| 2016 | $4,256 | $56,150 | $14,670 | $41,480 |
| 2015 | $3,883 | $56,150 | $14,670 | $41,480 |
| 2014 | $3,883 | $52,960 | $13,830 | $39,130 |
Source: Public Records
Map
Nearby Homes
- 14750 Seneca Trail
- 13505 Old Pleasant Valley Rd
- 7241 Baldwin Reserve Dr
- 6943 N Parkway Dr Unit H6943
- 7284 W Baldwin Reserve Dr
- 7280 Pearl Rd
- 7432 Baldwin Creek Dr
- 6988 Maplewood Rd
- 15510 Sandalhaven Dr
- 6771 Wood Creek Dr
- 7364 Pearl Rd
- 7330 Maplewood Rd
- 14330 Pawnee Trail
- 14280 Pawnee Trail
- 7032 Beresford Ave
- 16147 Ramona Dr
- 13689 Pineview Ct
- 6852 Oakwood Rd
- 7230 Greenleaf Ave
- 15983 Galemore Dr
- 14130 Shawnee Trail
- 14070 Shawnee Trail
- 14170 Shawnee Trail
- 14050 Shawnee Trail
- 13 Canterbury
- 14115 Shawnee Trail
- 14145 Shawnee Trail
- 14075 Shawnee Trail
- 14190 Shawnee Trail
- 14020 Shawnee Trail
- 14165 Shawnee Trail
- 14055 Shawnee Trail
- 14185 Shawnee Trail
- 14035 Shawnee Trail
- 14220 Shawnee Trail
- 13992 Shawnee Trail
- 14205 Shawnee Trail
- 14005 Shawnee Trail
- 14190 Old Pleasant Valley Rd
- 14220 Old Pleasant Valley Rd