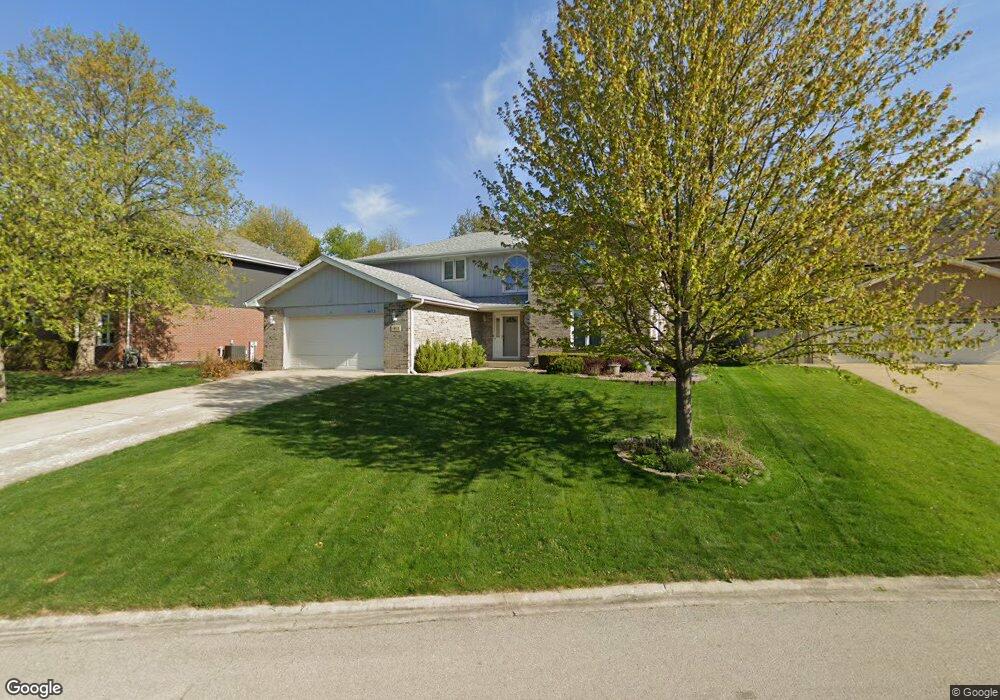
14112 W Dublin Dr Homer Glen, IL 60491
Estimated Value: $534,000 - $577,000
4
Beds
3
Baths
2,899
Sq Ft
$190/Sq Ft
Est. Value
About This Home
This home is located at 14112 W Dublin Dr, Homer Glen, IL 60491 and is currently estimated at $551,314, approximately $190 per square foot. 14112 W Dublin Dr is a home located in Will County with nearby schools including Reed Elementary School, Ludwig Elementary School, and Walsh Elementary School.
Ownership History
Date
Name
Owned For
Owner Type
Purchase Details
Closed on
Aug 15, 2017
Sold by
Flynn Jr Robert M O and Flynn Laura O
Bought by
Kluz Christopher T and Kluz Aneta M
Current Estimated Value
Home Financials for this Owner
Home Financials are based on the most recent Mortgage that was taken out on this home.
Original Mortgage
$289,600
Outstanding Balance
$241,060
Interest Rate
3.87%
Mortgage Type
New Conventional
Estimated Equity
$310,254
Purchase Details
Closed on
Apr 26, 2002
Sold by
Nemec Thomas A and Nemec Danette J
Bought by
Oflynn Robert M and Oflynn Laura
Purchase Details
Closed on
Aug 4, 1995
Sold by
Mizera Kenneth M and Mizera Kimberly D
Bought by
Nemec Thomas A and Nemec Danette J
Home Financials for this Owner
Home Financials are based on the most recent Mortgage that was taken out on this home.
Original Mortgage
$159,900
Interest Rate
7.55%
Create a Home Valuation Report for This Property
The Home Valuation Report is an in-depth analysis detailing your home's value as well as a comparison with similar homes in the area
Home Values in the Area
Average Home Value in this Area
Purchase History
| Date | Buyer | Sale Price | Title Company |
|---|---|---|---|
| Kluz Christopher T | $362,000 | Attorney | |
| Oflynn Robert M | $302,000 | Chicago Title Insurance Co | |
| Nemec Thomas A | $220,000 | -- |
Source: Public Records
Mortgage History
| Date | Status | Borrower | Loan Amount |
|---|---|---|---|
| Open | Kluz Christopher T | $289,600 | |
| Previous Owner | Nemec Thomas A | $159,900 |
Source: Public Records
Tax History Compared to Growth
Tax History
| Year | Tax Paid | Tax Assessment Tax Assessment Total Assessment is a certain percentage of the fair market value that is determined by local assessors to be the total taxable value of land and additions on the property. | Land | Improvement |
|---|---|---|---|---|
| 2024 | $10,040 | $159,497 | $30,761 | $128,736 |
| 2023 | $10,040 | $144,576 | $27,883 | $116,693 |
| 2022 | $8,996 | $134,992 | $26,035 | $108,957 |
| 2021 | $8,538 | $127,894 | $24,666 | $103,228 |
| 2020 | $8,558 | $123,188 | $23,758 | $99,430 |
| 2019 | $8,111 | $118,507 | $22,855 | $95,652 |
| 2018 | $8,443 | $121,115 | $22,593 | $98,522 |
| 2017 | $8,279 | $117,725 | $21,961 | $95,764 |
| 2016 | $8,086 | $113,799 | $21,229 | $92,570 |
| 2015 | $7,630 | $109,527 | $20,432 | $89,095 |
| 2014 | $7,630 | $107,264 | $20,010 | $87,254 |
| 2013 | $7,630 | $107,264 | $20,010 | $87,254 |
Source: Public Records
Map
Nearby Homes
- 13735 W Meath Dr
- 14151 131st St
- 13456 W Red Coat Dr
- 14690 Fox Hollow
- 13101 Eliza Ct
- 13175 Fox Ln
- 14605 131st St
- 13220 Fox Ln
- 14655 W Walnut Ave
- 13100 Fox Ln
- 12744 Caruso Ct
- 13245 Silver Fox Dr
- 14840 W 139th St
- 12723 Caruso Ct
- 13300 W Onondaga Trail
- 12652 Derby Rd
- 14344 Dixon Ln
- 12808 W Timberlane Ct
- 13408 W Catawba Ln
- 13952 S Oak Ridge Dr
- 14120 Dublin Ct
- 14106 W Dublin Dr
- 14126 Dublin Ct
- 14032 W Dublin Dr
- 14134 Dublin Ct
- 14107 W Dublin Dr
- 14119 W Dublin Dr
- 14033 W Dublin Dr
- 14142 Dublin Ct
- 13490 Derby Rd
- 0000 Dublin Ct
- 13534 W Dublin Dr
- 13535 W Dublin Dr
- 14027 W Dublin Dr
- 13500 Derby Rd
- 14024 W Dublin Dr
- 13470 Baltic Cir
- 14150 Dublin Ct
- 14141 Dublin Ct
- 13551 W Dublin Dr