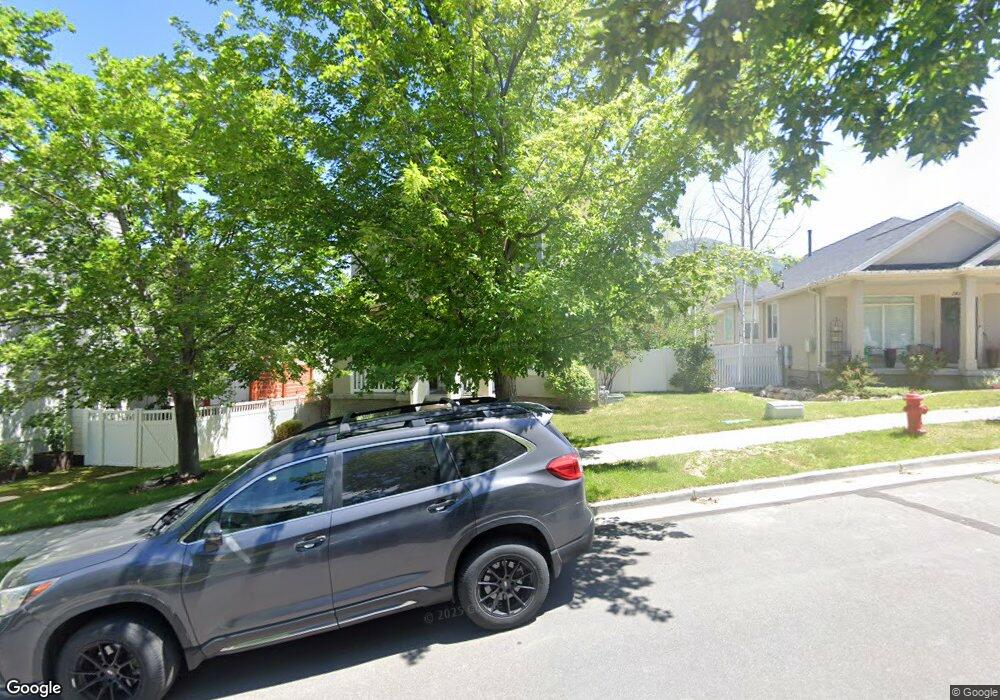
14119 Winfield Scott Way Draper, UT 84020
Estimated Value: $688,000 - $739,000
5
Beds
4
Baths
1,789
Sq Ft
$398/Sq Ft
Est. Value
About This Home
This home is located at 14119 Winfield Scott Way, Draper, UT 84020 and is currently estimated at $711,664, approximately $397 per square foot. 14119 Winfield Scott Way is a home located in Salt Lake County with nearby schools including Oak Hollow School, Draper Park Middle School, and Corner Canyon High School.
Ownership History
Date
Name
Owned For
Owner Type
Purchase Details
Closed on
Oct 22, 2019
Sold by
Jenson Rodney H and Jenson Cynthia T
Bought by
Winfield Scott Way Llc
Current Estimated Value
Purchase Details
Closed on
Feb 19, 2015
Sold by
Schroeder George and Schroeder Donna M
Bought by
Jenson Rodney H and Jenson Cynthia T
Purchase Details
Closed on
Aug 29, 2005
Sold by
Spencer Joseph M and Spencer Jennifer
Bought by
Schroeder George and Schroeder Donna M
Home Financials for this Owner
Home Financials are based on the most recent Mortgage that was taken out on this home.
Original Mortgage
$196,000
Interest Rate
5.64%
Mortgage Type
New Conventional
Purchase Details
Closed on
Mar 29, 1996
Sold by
Pulte Home Corp
Bought by
Spencer Joseph M and Spencer Jennifer
Home Financials for this Owner
Home Financials are based on the most recent Mortgage that was taken out on this home.
Original Mortgage
$185,977
Interest Rate
8%
Mortgage Type
VA
Create a Home Valuation Report for This Property
The Home Valuation Report is an in-depth analysis detailing your home's value as well as a comparison with similar homes in the area
Home Values in the Area
Average Home Value in this Area
Purchase History
| Date | Buyer | Sale Price | Title Company |
|---|---|---|---|
| Winfield Scott Way Llc | -- | None Available | |
| Jenson Rodney H | -- | Title Guarantee S Jordan | |
| Schroeder George | -- | Superior Title | |
| Spencer Joseph M | -- | -- |
Source: Public Records
Mortgage History
| Date | Status | Borrower | Loan Amount |
|---|---|---|---|
| Previous Owner | Schroeder George | $196,000 | |
| Previous Owner | Spencer Joseph M | $185,977 |
Source: Public Records
Tax History Compared to Growth
Tax History
| Year | Tax Paid | Tax Assessment Tax Assessment Total Assessment is a certain percentage of the fair market value that is determined by local assessors to be the total taxable value of land and additions on the property. | Land | Improvement |
|---|---|---|---|---|
| 2025 | $2,873 | $570,200 | $169,200 | $401,000 |
| 2024 | $2,873 | $548,900 | $161,800 | $387,100 |
| 2023 | $2,544 | $482,400 | $153,200 | $329,200 |
| 2022 | $2,653 | $486,000 | $150,200 | $335,800 |
| 2021 | $2,493 | $390,100 | $110,100 | $280,000 |
| 2020 | $2,369 | $351,400 | $92,200 | $259,200 |
| 2019 | $2,367 | $343,000 | $90,800 | $252,200 |
| 2018 | $2,159 | $319,800 | $87,900 | $231,900 |
| 2017 | $2,150 | $305,000 | $72,900 | $232,100 |
| 2016 | $2,092 | $288,500 | $72,900 | $215,600 |
| 2015 | $2,003 | $255,800 | $70,800 | $185,000 |
| 2014 | $1,928 | $240,500 | $67,200 | $173,300 |
Source: Public Records
Map
Nearby Homes
- 14044 Pepi Band Rd
- 13941 S Jarvie Ln
- 957 Senior Band Rd
- 14119 S Senior Band Rd
- 913 E Spiers Ln
- 928 E Rocky Mouth Ln
- 919 E Rocky Mouth Ln
- 760 E Corner Ridge Dr
- 919 E 13800 S
- 13881 Vestry Rd
- 492 W Maidengrass Way
- 14669 S Faulkridge Ct Unit 106
- 14793 S Vintage View Ln Unit 14
- 13164 S City Point Cove Unit 1
- 1314 E Victor Ln
- 13189 S City Point Cove E Unit 4
- 1349 E Elk Unit 33
- 598 Hollow Creek Rd
- 13826 S Tom Shoemaker Cir
- 14585 S Delacroix Dr
- 14119 S Winfield Scott Way
- 14121 Winfield Scott Way
- 14111 Winfield Scott Way
- 14109 S Winfield Scott Way
- 14109 Winfield Scott Way
- 14088 Candy Pull Dr
- 14088 S Candy Pull Dr
- 14098 Candy Pull Dr
- 14098 S Candy Pull Dr
- 14128 Winfield Scott Way
- 14106 Candy Pull Dr
- 14106 S Candy Pull Dr
- 14082 Candy Pull Dr
- 14126 Winfield Scott Way
- 14107 Winfield Scott Way
- 1083 Skyler Dr
- 1075 Skyler Dr
- 1089 E Skyler Dr
- 1089 Skyler Dr
- 1067 E Skyler Dr