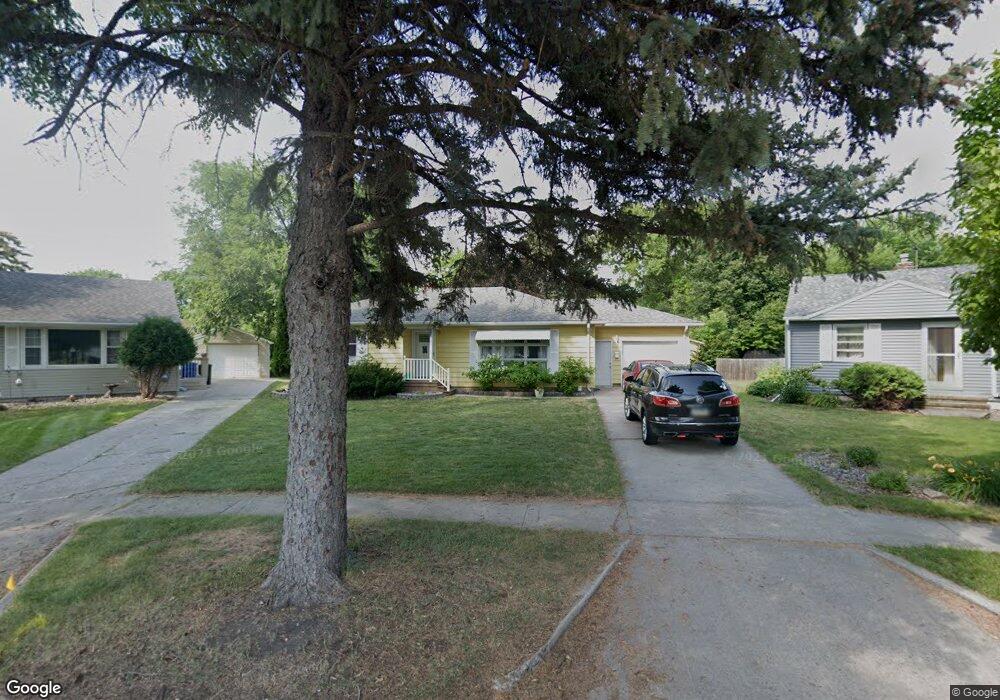
1412 11th St S Fargo, ND 58103
Clara Barton NeighborhoodEstimated Value: $252,000 - $283,000
4
Beds
2
Baths
2,360
Sq Ft
$113/Sq Ft
Est. Value
About This Home
This home is located at 1412 11th St S, Fargo, ND 58103 and is currently estimated at $267,822, approximately $113 per square foot. 1412 11th St S is a home located in Cass County with nearby schools including Clara Barton Elementary School, Carl Ben Eielson Middle School, and South High School.
Ownership History
Date
Name
Owned For
Owner Type
Purchase Details
Closed on
Jul 30, 2019
Sold by
Mcnary Kasey D and Mcnary Anna L
Bought by
Martin Kristopher Lee and Martin Millissa
Current Estimated Value
Home Financials for this Owner
Home Financials are based on the most recent Mortgage that was taken out on this home.
Original Mortgage
$153,600
Outstanding Balance
$134,801
Interest Rate
3.8%
Mortgage Type
New Conventional
Estimated Equity
$133,021
Purchase Details
Closed on
Mar 6, 2019
Sold by
Mcnary Kasey D and Mcnary Anna L
Bought by
Mcnary Kasey D and Mcnary Anna L
Purchase Details
Closed on
Jul 27, 2012
Sold by
Kava Ryan P and Kava Jennifer J
Bought by
Mcnary Kasey D
Home Financials for this Owner
Home Financials are based on the most recent Mortgage that was taken out on this home.
Original Mortgage
$139,080
Interest Rate
3.73%
Mortgage Type
New Conventional
Create a Home Valuation Report for This Property
The Home Valuation Report is an in-depth analysis detailing your home's value as well as a comparison with similar homes in the area
Home Values in the Area
Average Home Value in this Area
Purchase History
| Date | Buyer | Sale Price | Title Company |
|---|---|---|---|
| Martin Kristopher Lee | $192,000 | Title Co | |
| Mcnary Kasey D | -- | None Available | |
| Mcnary Kasey D | $146,400 | Fm Title |
Source: Public Records
Mortgage History
| Date | Status | Borrower | Loan Amount |
|---|---|---|---|
| Open | Martin Kristopher Lee | $153,600 | |
| Previous Owner | Mcnary Kasey D | $139,080 |
Source: Public Records
Tax History Compared to Growth
Tax History
| Year | Tax Paid | Tax Assessment Tax Assessment Total Assessment is a certain percentage of the fair market value that is determined by local assessors to be the total taxable value of land and additions on the property. | Land | Improvement |
|---|---|---|---|---|
| 2024 | $5,454 | $131,800 | $34,100 | $97,700 |
| 2023 | $3,537 | $123,200 | $34,100 | $89,100 |
| 2022 | $3,186 | $115,150 | $34,100 | $81,050 |
| 2021 | $2,888 | $106,100 | $34,100 | $72,000 |
| 2020 | $2,773 | $102,000 | $34,100 | $67,900 |
| 2019 | $2,571 | $95,350 | $18,950 | $76,400 |
| 2018 | $2,538 | $95,350 | $18,950 | $76,400 |
| 2017 | $2,440 | $92,550 | $18,950 | $73,600 |
| 2016 | $2,179 | $89,850 | $18,950 | $70,900 |
| 2015 | $1,984 | $76,750 | $14,200 | $62,550 |
| 2014 | $1,886 | $71,050 | $14,200 | $56,850 |
| 2013 | $1,888 | $71,050 | $14,200 | $56,850 |
Source: Public Records
Map
Nearby Homes
- 1425 11th St S
- 1439 10th St S
- 1301 10th St S
- 1208 University Dr S
- 1314 14th St S
- 1124 University Dr S
- 1550 13 1 2 St S
- 1614 10th St S
- 1112 University Dr S
- 1361 16th Ave S
- 1418 12th Ave S
- 1550 14 1 2 St S
- 1418 11th Ave S
- 1710 14th St S
- 1020 9th Ave S
- 910 University Dr S
- 911 8th St S
- 1414 10th Ave S
- 1545 15th St S
- 820 10th St S Unit C20
- 1416 11th St S
- 1101 14 1/2 Ave S
- 1014 14th Ave S
- 1010 14th Ave S
- 1018 14th Ave S
- 1420 11th St S
- 1105 14 1/2 Ave S
- 1407 10th St S
- 1105 14 1 2 Ave S
- 1405 10th St S
- 1409 10th St S
- 1102 14th Ave S
- 1403 10th St S
- 1421 10th St S
- 1424 11th St S
- 1109 14 1/2 Ave S
- 1401 10th St S
- 1433 10th St S
- 1106 14th Ave S
- 1435 10th St S