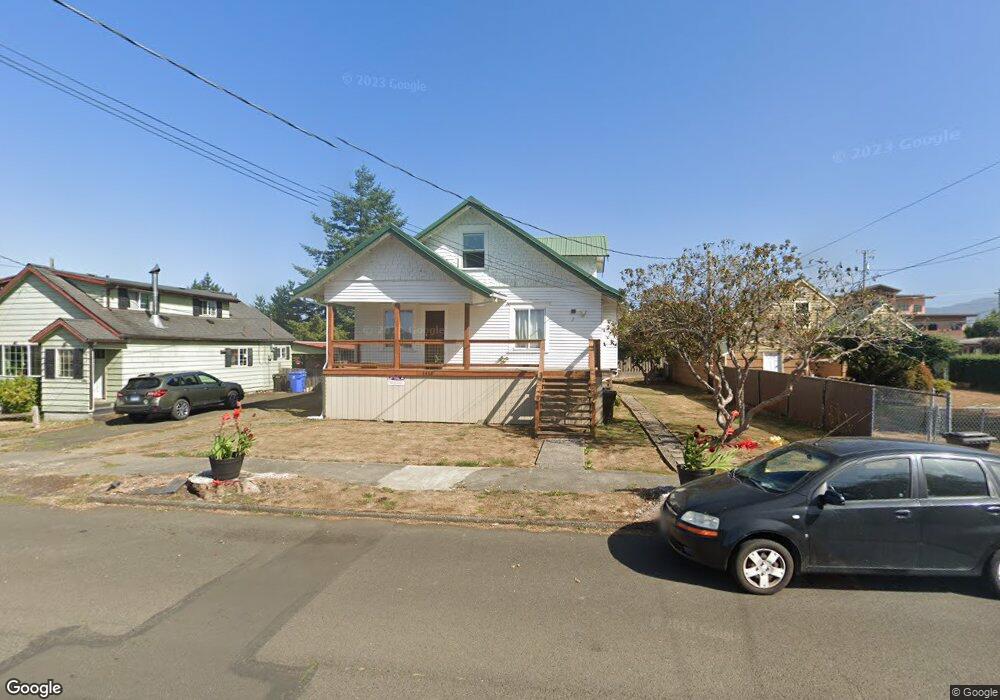
1412 4th St Tillamook, OR 97141
Estimated Value: $243,278 - $478,000
4
Beds
3
Baths
2,340
Sq Ft
$162/Sq Ft
Est. Value
About This Home
This home is located at 1412 4th St, Tillamook, OR 97141 and is currently estimated at $378,570, approximately $161 per square foot. 1412 4th St is a home located in Tillamook County with nearby schools including Tillamook High School, Little Clipper Preschool, and Tillamook Adventist School.
Ownership History
Date
Name
Owned For
Owner Type
Purchase Details
Closed on
Jul 5, 2018
Sold by
Rodrigues Northon and Rodrigues Doris
Bought by
Homes For Rent Llc
Current Estimated Value
Purchase Details
Closed on
Jun 20, 2017
Sold by
Homes For Rent Llc
Bought by
Rodrigues Northon and Rodrigues Doris
Purchase Details
Closed on
Oct 20, 2016
Sold by
Johnson Beverly J
Bought by
Homes For Rent Llc
Purchase Details
Closed on
Oct 1, 2010
Sold by
Hanson Family Llc
Bought by
Johnson Beverly J
Create a Home Valuation Report for This Property
The Home Valuation Report is an in-depth analysis detailing your home's value as well as a comparison with similar homes in the area
Home Values in the Area
Average Home Value in this Area
Purchase History
| Date | Buyer | Sale Price | Title Company |
|---|---|---|---|
| Homes For Rent Llc | -- | None Available | |
| Rodrigues Northon | -- | None Available | |
| Homes For Rent Llc | $143,000 | Ticor Title Company Of Or | |
| Johnson Beverly J | -- | None Available |
Source: Public Records
Tax History Compared to Growth
Tax History
| Year | Tax Paid | Tax Assessment Tax Assessment Total Assessment is a certain percentage of the fair market value that is determined by local assessors to be the total taxable value of land and additions on the property. | Land | Improvement |
|---|---|---|---|---|
| 2024 | $2,161 | $181,390 | $65,820 | $115,570 |
| 2023 | $2,141 | $176,110 | $63,900 | $112,210 |
| 2022 | $2,069 | $170,990 | $62,040 | $108,950 |
| 2021 | $2,008 | $166,010 | $60,240 | $105,770 |
| 2020 | $1,954 | $161,180 | $58,490 | $102,690 |
| 2019 | $1,905 | $156,490 | $56,780 | $99,710 |
| 2018 | $1,856 | $151,940 | $55,130 | $96,810 |
| 2017 | $1,810 | $147,520 | $53,530 | $93,990 |
| 2016 | $1,367 | $113,710 | $38,940 | $74,770 |
| 2015 | $1,339 | $110,400 | $37,810 | $72,590 |
| 2014 | $1,317 | $107,190 | $36,710 | $70,480 |
| 2013 | -- | $104,070 | $35,640 | $68,430 |
Source: Public Records
Map
Nearby Homes