Estimated Value: $160,369 - $183,000
2
Beds
1
Bath
1,022
Sq Ft
$165/Sq Ft
Est. Value
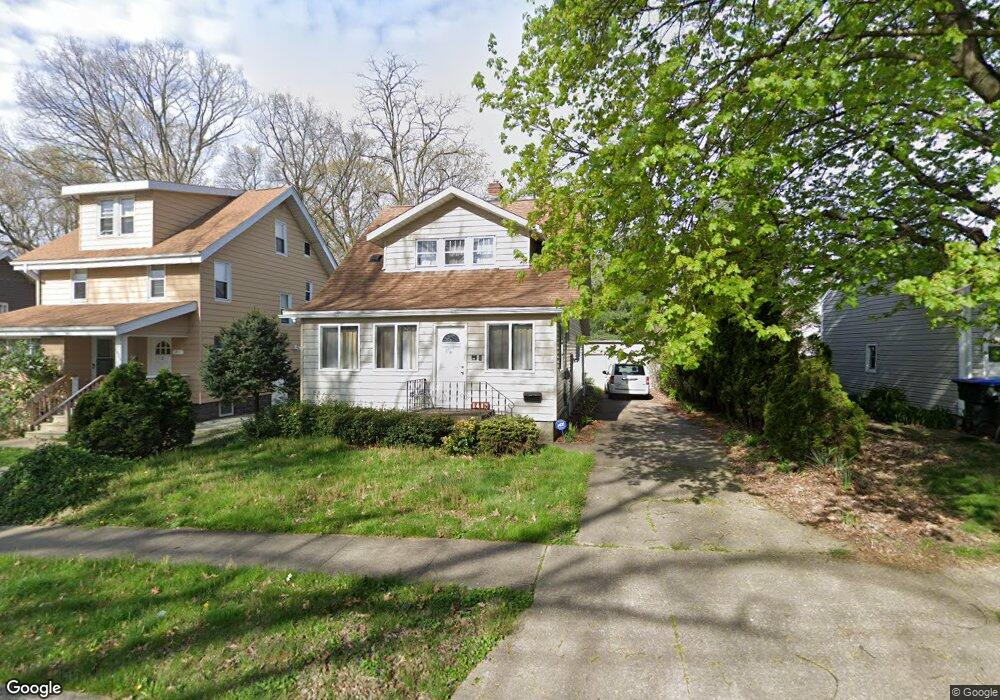
About This Home
This home is located at 1412 9th St, Cuyahoga Falls, OH 44221 and is currently estimated at $168,842, approximately $165 per square foot. 1412 9th St is a home located in Summit County with nearby schools including Dewitt Elementary School, Bolich Middle School, and Cuyahoga Falls High School.
Ownership History
Date
Name
Owned For
Owner Type
Purchase Details
Closed on
Sep 6, 2007
Sold by
Herbert Lenny N
Bought by
Coast John D
Current Estimated Value
Home Financials for this Owner
Home Financials are based on the most recent Mortgage that was taken out on this home.
Original Mortgage
$39,000
Interest Rate
6.72%
Mortgage Type
Purchase Money Mortgage
Purchase Details
Closed on
Jul 25, 2007
Sold by
Citimortgage Inc
Bought by
Herbert Lenny N
Home Financials for this Owner
Home Financials are based on the most recent Mortgage that was taken out on this home.
Original Mortgage
$39,000
Interest Rate
6.72%
Mortgage Type
Purchase Money Mortgage
Purchase Details
Closed on
Nov 29, 2006
Sold by
Murphy Patrick K
Bought by
Citimortgage Inc
Purchase Details
Closed on
Dec 12, 1994
Sold by
Gonzi Richard S
Bought by
Murphy Patrick and Murphy Alecia
Home Financials for this Owner
Home Financials are based on the most recent Mortgage that was taken out on this home.
Original Mortgage
$63,801
Interest Rate
9.06%
Mortgage Type
New Conventional
Create a Home Valuation Report for This Property
The Home Valuation Report is an in-depth analysis detailing your home's value as well as a comparison with similar homes in the area
Home Values in the Area
Average Home Value in this Area
Purchase History
| Date | Buyer | Sale Price | Title Company |
|---|---|---|---|
| Coast John D | $37,900 | First Security Title Corp | |
| Herbert Lenny N | $29,900 | Sovereign Title Agency Llc | |
| Citimortgage Inc | $62,900 | Sovereign Title Agency Llc | |
| Murphy Patrick | $51,000 | -- |
Source: Public Records
Mortgage History
| Date | Status | Borrower | Loan Amount |
|---|---|---|---|
| Previous Owner | Coast John D | $39,000 | |
| Previous Owner | Herbert Lenny N | $46,000 | |
| Previous Owner | Murphy Patrick | $63,801 |
Source: Public Records
Tax History Compared to Growth
Tax History
| Year | Tax Paid | Tax Assessment Tax Assessment Total Assessment is a certain percentage of the fair market value that is determined by local assessors to be the total taxable value of land and additions on the property. | Land | Improvement |
|---|---|---|---|---|
| 2025 | $1,991 | $46,033 | $10,805 | $35,228 |
| 2024 | $1,991 | $46,033 | $10,805 | $35,228 |
| 2023 | $1,991 | $46,033 | $10,805 | $35,228 |
| 2022 | $1,701 | $34,321 | $7,945 | $26,376 |
| 2021 | $1,701 | $34,321 | $7,945 | $26,376 |
| 2020 | $1,673 | $34,330 | $7,950 | $26,380 |
| 2019 | $1,403 | $28,300 | $7,550 | $20,750 |
| 2018 | $1,191 | $28,300 | $7,550 | $20,750 |
| 2017 | $1,577 | $28,300 | $7,550 | $20,750 |
| 2016 | $1,578 | $25,500 | $7,550 | $17,950 |
| 2015 | $1,577 | $25,500 | $7,550 | $17,950 |
| 2014 | $1,887 | $25,500 | $7,550 | $17,950 |
| 2013 | $1,990 | $27,380 | $7,550 | $19,830 |
Source: Public Records
Map
Nearby Homes
- 852 Arcadia Ave
- 1523 8th St
- 1333 Meriline St
- 1510 2nd St
- 1312 Riverside Dr
- 736 Chestnut Blvd
- 1348 Grant Ave
- 1247 Clifton Ave
- 1224 Chestnut Blvd
- 1740 11th St
- 120 Grant Ave
- 1202 Clifton Ave
- 839 Sackett Ave
- 1624 17th St
- 1839 9th St
- 1757 3rd St
- 1734 Front St Unit 34
- 1734 Front St Unit 37
- 1734 Front St Unit 36
- 1734 Front St Unit 35
- 1406 9th St
- 912 Francis Ave
- 1400 9th St
- 1418 9th St
- 928 Francis Ave
- 928 Francis Ave
- 872 Francis Ave
- 1000 Francis Ave
- 872 Arcadia Ave
- 1486 9th St
- 859 Arcadia Ave
- 1382 9th St
- 1483 10th St
- 1380 9th St Unit 1382
- V/L 9th St
- 851 Arcadia Ave
- 854 Francis Ave Unit 856
- 854 Francis Ave Unit 856
- 854 Francis Ave Unit 856
- 854 Francis Ave Unit 856