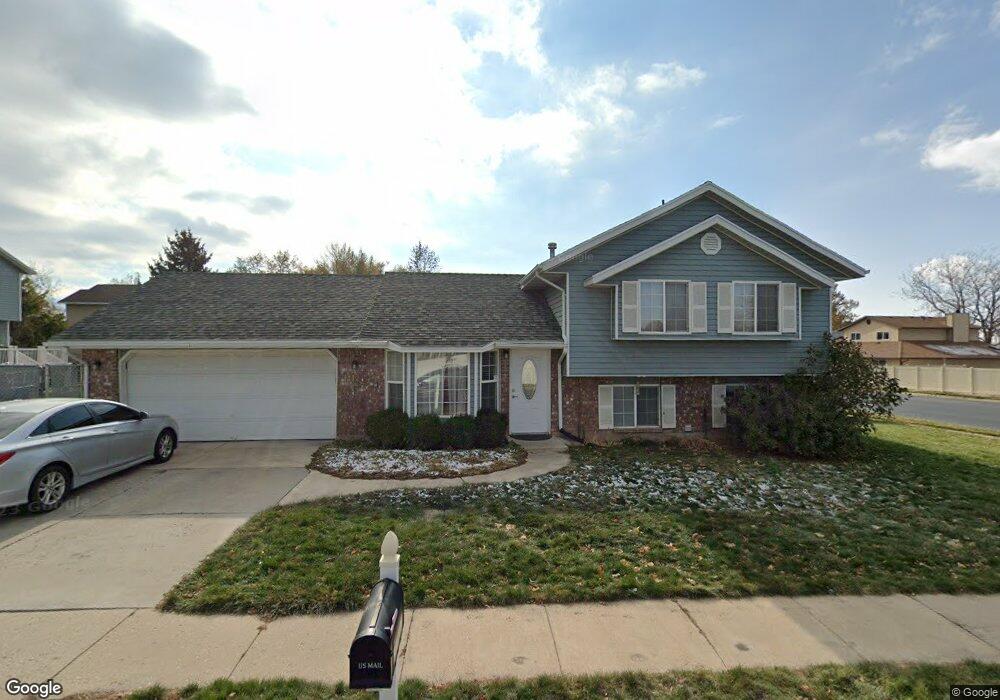
1412 Jeff St Layton, UT 84040
Estimated Value: $447,000 - $491,000
4
Beds
3
Baths
1,780
Sq Ft
$268/Sq Ft
Est. Value
About This Home
This home is located at 1412 Jeff St, Layton, UT 84040 and is currently estimated at $477,856, approximately $268 per square foot. 1412 Jeff St is a home located in Davis County with nearby schools including East Layton Elementary School, Central Davis Junior High School, and Layton High School.
Ownership History
Date
Name
Owned For
Owner Type
Purchase Details
Closed on
May 27, 2016
Sold by
Bills Nathan and Bills Amanda
Bought by
Webb Gayleen and Webb Bart
Current Estimated Value
Purchase Details
Closed on
Aug 29, 2007
Sold by
Crane Amanda A and Bills Nathan
Bought by
Bills Nathan and Bills Amanda A
Home Financials for this Owner
Home Financials are based on the most recent Mortgage that was taken out on this home.
Original Mortgage
$190,000
Interest Rate
6.74%
Mortgage Type
New Conventional
Purchase Details
Closed on
Jul 28, 1999
Sold by
Olson David C and Olson Paige L
Bought by
Phelts Craig R and Phelts Sheila J
Home Financials for this Owner
Home Financials are based on the most recent Mortgage that was taken out on this home.
Original Mortgage
$124,417
Interest Rate
7.64%
Mortgage Type
FHA
Create a Home Valuation Report for This Property
The Home Valuation Report is an in-depth analysis detailing your home's value as well as a comparison with similar homes in the area
Home Values in the Area
Average Home Value in this Area
Purchase History
| Date | Buyer | Sale Price | Title Company |
|---|---|---|---|
| Webb Gayleen | -- | Highland Title | |
| Bills Nathan | -- | Equity Title Ins Agency Inc | |
| Crane Amanda A | -- | First American Title | |
| Phelts Craig R | -- | Bonneville Title Company Inc |
Source: Public Records
Mortgage History
| Date | Status | Borrower | Loan Amount |
|---|---|---|---|
| Previous Owner | Bills Nathan | $190,000 | |
| Previous Owner | Phelts Craig R | $124,417 |
Source: Public Records
Tax History Compared to Growth
Tax History
| Year | Tax Paid | Tax Assessment Tax Assessment Total Assessment is a certain percentage of the fair market value that is determined by local assessors to be the total taxable value of land and additions on the property. | Land | Improvement |
|---|---|---|---|---|
| 2025 | $2,253 | $236,500 | $120,198 | $116,302 |
| 2024 | $2,153 | $227,700 | $142,501 | $85,199 |
| 2023 | $2,114 | $394,000 | $191,412 | $202,588 |
| 2022 | $2,244 | $227,150 | $102,737 | $124,413 |
| 2021 | $2,067 | $312,000 | $156,457 | $155,543 |
| 2020 | $1,823 | $264,000 | $127,089 | $136,911 |
| 2019 | $1,798 | $255,000 | $113,442 | $141,558 |
| 2018 | $1,629 | $232,000 | $88,622 | $143,378 |
| 2016 | $1,369 | $100,540 | $46,580 | $53,960 |
| 2015 | $1,294 | $90,255 | $49,032 | $41,223 |
| 2014 | $1,224 | $87,254 | $49,032 | $38,222 |
| 2013 | -- | $89,529 | $22,748 | $66,781 |
Source: Public Records
Map
Nearby Homes
- 1884 Nalder St
- 1281 E South Lisa St
- 1122 E 1250 N
- 1657 E Cherry Ln
- 1340 E Hollyhock Way
- Richards Plan at Eastridge Park - The Vistas
- Brynlee Plan at Eastridge Park - The Vistas
- Brynlee Plan at Eastridge Park - The Heights
- Ontario Plan at Eastridge Park - The Heights
- Mclauren Plan at Eastridge Park - The Vistas
- Escher Plan at Eastridge Park - The Vistas
- Rivershore Plan at Eastridge Park - The Vistas
- Helene Plan at Eastridge Park - The Vistas
- Bromley Plan at Eastridge Park - The Heights
- Beringwood Plan at Eastridge Park - The Heights
- Caulfield Plan at Eastridge Park - The Heights
- Hawthorne Plan at Eastridge Park - The Heights
- Kimbrough Plan at Eastridge Park - The Vistas
- Cedarbark Plan at Eastridge Park - The Heights
- 1204 N 1875 E Unit 5