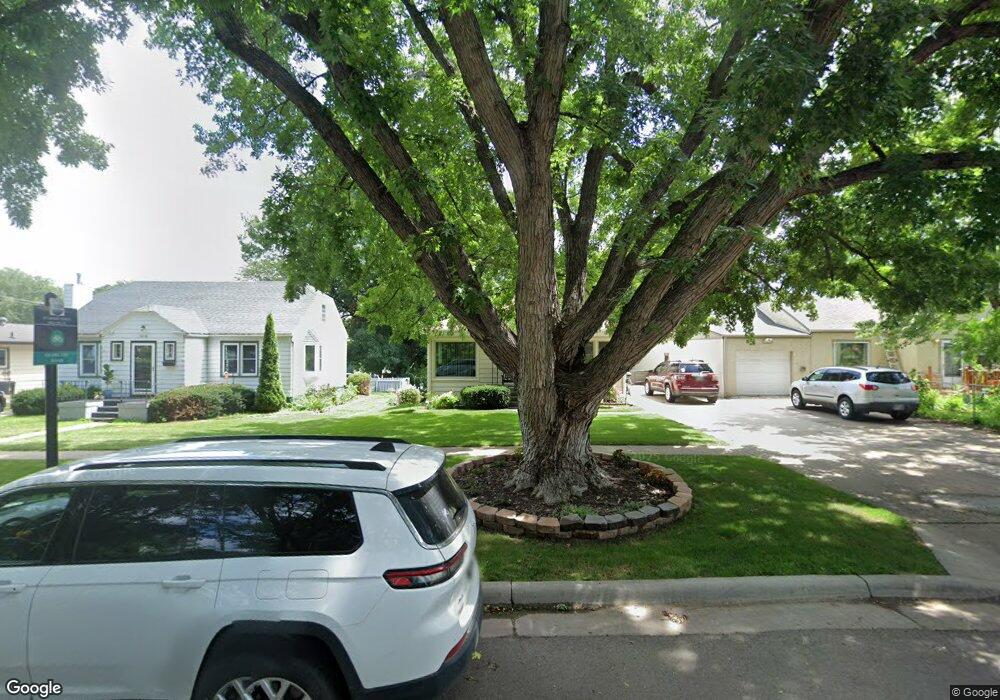
1412 Mulberry St Yankton, SD 57078
Estimated Value: $206,000 - $234,000
3
Beds
2
Baths
1,120
Sq Ft
$196/Sq Ft
Est. Value
About This Home
This home is located at 1412 Mulberry St, Yankton, SD 57078 and is currently estimated at $220,066, approximately $196 per square foot. 1412 Mulberry St is a home located in Yankton County with nearby schools including Beadle Elementary School, Yankton Middle School - 02, and Yankton High School.
Ownership History
Date
Name
Owned For
Owner Type
Purchase Details
Closed on
Sep 29, 2006
Sold by
Thompson Kyle A and Thompson Revocable T Beverly R
Bought by
Tritschler Mary F
Current Estimated Value
Home Financials for this Owner
Home Financials are based on the most recent Mortgage that was taken out on this home.
Original Mortgage
$52,500
Outstanding Balance
$31,310
Interest Rate
6.45%
Mortgage Type
New Conventional
Estimated Equity
$188,756
Create a Home Valuation Report for This Property
The Home Valuation Report is an in-depth analysis detailing your home's value as well as a comparison with similar homes in the area
Home Values in the Area
Average Home Value in this Area
Purchase History
| Date | Buyer | Sale Price | Title Company |
|---|---|---|---|
| Tritschler Mary F | $105,000 | Yankton Title |
Source: Public Records
Mortgage History
| Date | Status | Borrower | Loan Amount |
|---|---|---|---|
| Open | Tritschler Mary F | $52,500 |
Source: Public Records
Tax History Compared to Growth
Tax History
| Year | Tax Paid | Tax Assessment Tax Assessment Total Assessment is a certain percentage of the fair market value that is determined by local assessors to be the total taxable value of land and additions on the property. | Land | Improvement |
|---|---|---|---|---|
| 2025 | $2,674 | $202,100 | $13,000 | $189,100 |
| 2024 | $2,574 | $193,000 | $13,000 | $180,000 |
| 2023 | $2,476 | $176,500 | $13,000 | $163,500 |
| 2022 | $2,231 | $160,700 | $11,800 | $148,900 |
| 2021 | $2,226 | $142,500 | $11,800 | $130,700 |
| 2020 | $2,014 | $142,500 | $0 | $0 |
| 2019 | $1,759 | $136,400 | $0 | $0 |
| 2018 | $1,717 | $125,500 | $0 | $0 |
| 2017 | $1,625 | $122,700 | $0 | $0 |
| 2016 | -- | $113,100 | $0 | $0 |
| 2015 | -- | $105,300 | $0 | $0 |
| 2014 | -- | $96,800 | $0 | $0 |
| 2013 | -- | $96,800 | $0 | $0 |
Source: Public Records
Map
Nearby Homes