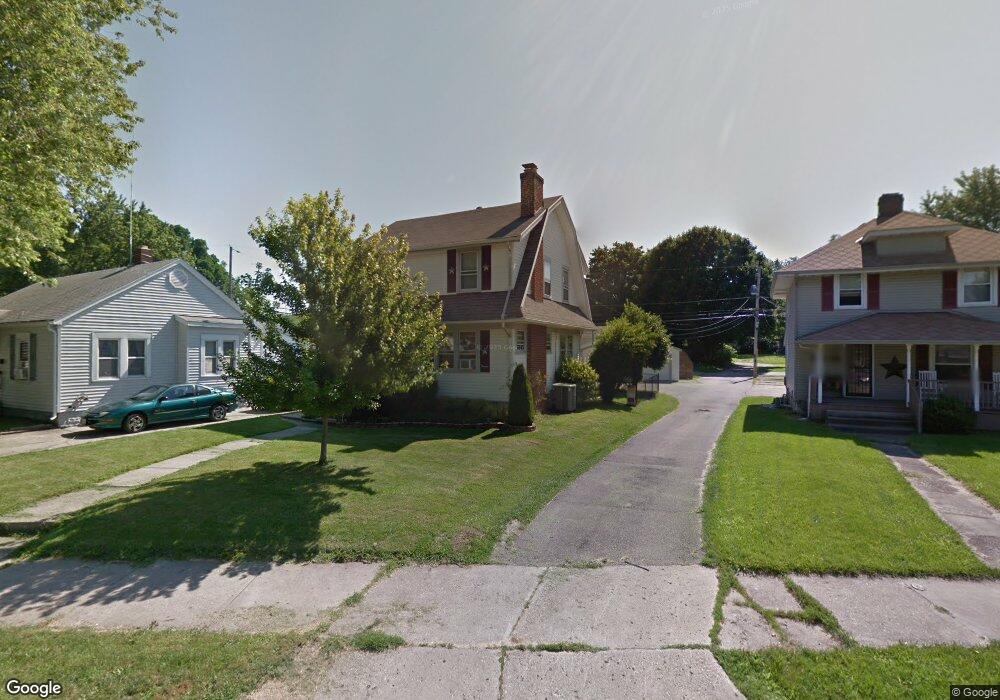
1412 Selma Rd Springfield, OH 45505
Estimated Value: $122,000 - $139,000
3
Beds
1
Bath
1,212
Sq Ft
$107/Sq Ft
Est. Value
About This Home
This home is located at 1412 Selma Rd, Springfield, OH 45505 and is currently estimated at $129,318, approximately $106 per square foot. 1412 Selma Rd is a home located in Clark County with nearby schools including Kenwood Elementary School, Hayward Middle School, and Springfield High School.
Ownership History
Date
Name
Owned For
Owner Type
Purchase Details
Closed on
Feb 12, 2015
Sold by
Nuckols John W
Bought by
Richwine Zackarey A
Current Estimated Value
Home Financials for this Owner
Home Financials are based on the most recent Mortgage that was taken out on this home.
Original Mortgage
$51,450
Outstanding Balance
$40,062
Interest Rate
3.66%
Mortgage Type
FHA
Estimated Equity
$89,256
Purchase Details
Closed on
Oct 14, 2011
Sold by
Moorman Timothy E and Moorman Margaret S
Bought by
Nuckols John W
Home Financials for this Owner
Home Financials are based on the most recent Mortgage that was taken out on this home.
Original Mortgage
$59,900
Interest Rate
4.12%
Mortgage Type
New Conventional
Purchase Details
Closed on
Apr 1, 1979
Sold by
Eldridge James M and Eldridge Sharon S
Bought by
Moorman Timothy E and Moorman Margaret S
Create a Home Valuation Report for This Property
The Home Valuation Report is an in-depth analysis detailing your home's value as well as a comparison with similar homes in the area
Home Values in the Area
Average Home Value in this Area
Purchase History
| Date | Buyer | Sale Price | Title Company |
|---|---|---|---|
| Richwine Zackarey A | $52,400 | Attorney | |
| Nuckols John W | $59,900 | Team Title & Closing Service | |
| Moorman Timothy E | $32,900 | -- |
Source: Public Records
Mortgage History
| Date | Status | Borrower | Loan Amount |
|---|---|---|---|
| Open | Richwine Zackarey A | $51,450 | |
| Previous Owner | Nuckols John W | $59,900 |
Source: Public Records
Tax History Compared to Growth
Tax History
| Year | Tax Paid | Tax Assessment Tax Assessment Total Assessment is a certain percentage of the fair market value that is determined by local assessors to be the total taxable value of land and additions on the property. | Land | Improvement |
|---|---|---|---|---|
| 2024 | $1,354 | $28,090 | $5,090 | $23,000 |
| 2023 | $1,354 | $28,090 | $5,090 | $23,000 |
| 2022 | $1,387 | $28,090 | $5,090 | $23,000 |
| 2021 | $1,173 | $21,930 | $3,100 | $18,830 |
| 2020 | $1,175 | $21,930 | $3,100 | $18,830 |
| 2019 | $1,178 | $21,930 | $3,100 | $18,830 |
| 2018 | $1,275 | $22,790 | $2,910 | $19,880 |
| 2017 | $1,274 | $24,906 | $2,912 | $21,994 |
| 2016 | $1,275 | $24,906 | $2,912 | $21,994 |
| 2015 | $1,279 | $22,337 | $2,912 | $19,425 |
| 2014 | $1,273 | $22,337 | $2,912 | $19,425 |
| 2013 | $1,260 | $22,337 | $2,912 | $19,425 |
Source: Public Records
Map
Nearby Homes
- 1210 Burt St
- 1562 Rutland Ave
- 1159 Selma Rd
- 1102 Pine St
- 905 Rice St
- 1225 Beacon St
- 1435 Logan Ave
- 842 Oak St
- 1024 Elder St
- 1047 Cypress St
- 1815 Beacon St
- 1810 Kenwood Ave
- 1716 N Sweetbriar Ln
- 902 Cypress St
- 1630 S Sweetbriar Ln
- 1714 Kenton St
- 1915 Kenwood Ave
- 710-712 Cypress St
- 550 E Rose St
- 1519 Tibbetts Ave
- 1418 Selma Rd
- 1408 Selma Rd
- 1402 Selma Rd
- 1424 Selma Rd
- 1333 Rutland Ave
- 1335 Rutland Ave
- 1430 Selma Rd
- 1411 Selma Rd
- 1419 Selma Rd
- 1425 Selma Rd
- 1321 Rutland Ave
- 1436 Selma Rd
- 1330 Selma Rd
- 1337 Rutland Ave
- 1322 Rutland Ave
- 1326 Rutland Ave
- 1316 Rutland Ave
- 1336 Rutland Ave
- 1343 Rutland Ave
- 1324 Selma Rd