Estimated Value: $88,447 - $126,000
--
Bed
1
Bath
1,064
Sq Ft
$107/Sq Ft
Est. Value
About This Home
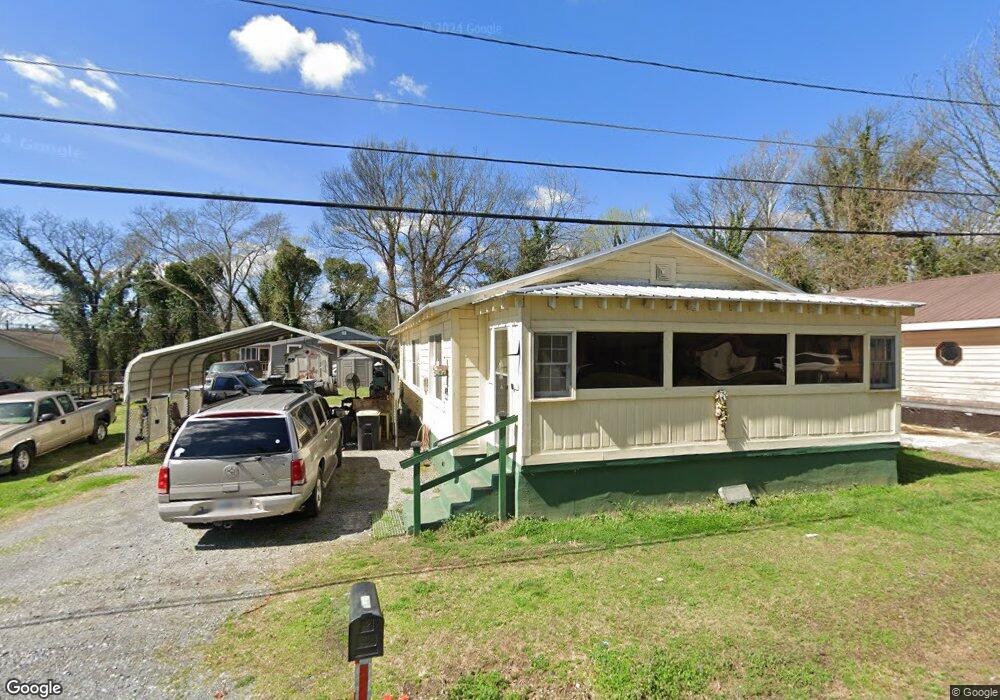
This home is located at 1412 Spring Creek St SW, Rome, GA 30161 and is currently estimated at $113,612, approximately $106 per square foot. 1412 Spring Creek St SW is a home located in Floyd County with nearby schools including Dan McCarty Middle School, Rome High School, and St. Mary School.
Ownership History
Date
Name
Owned For
Owner Type
Purchase Details
Closed on
Apr 7, 2005
Sold by
Floyd County
Bought by
Sullivan Richard
Current Estimated Value
Purchase Details
Closed on
Nov 10, 2003
Sold by
Hill William
Bought by
Sullivan Richard
Purchase Details
Closed on
Jul 28, 1995
Sold by
Stewart Harold C
Bought by
Hill William
Purchase Details
Closed on
Mar 29, 1988
Sold by
Montgomery Kenneth Lee
Bought by
Stewart Harold C
Purchase Details
Closed on
Jan 6, 1984
Bought by
P and R
Purchase Details
Closed on
Dec 6, 1983
Sold by
Hight Clarence
Bought by
Montgomery Kenneth Lee
Purchase Details
Closed on
Mar 15, 1983
Sold by
Hieght Willie Mae and Hieght Clarence
Bought by
Hight Clarence
Purchase Details
Closed on
Jun 4, 1971
Sold by
Dempsey Ray
Bought by
Hieght Willie Mae and Hieght Clarence
Purchase Details
Closed on
Feb 23, 1971
Sold by
Morgan Jackson D
Bought by
Dempsey Ray
Purchase Details
Closed on
Jan 1, 1970
Sold by
Morgan B C
Bought by
Morgan Jackson D
Purchase Details
Closed on
Jul 1, 1955
Bought by
Morgan B C
Create a Home Valuation Report for This Property
The Home Valuation Report is an in-depth analysis detailing your home's value as well as a comparison with similar homes in the area
Home Values in the Area
Average Home Value in this Area
Purchase History
| Date | Buyer | Sale Price | Title Company |
|---|---|---|---|
| Sullivan Richard | -- | -- | |
| Sullivan Richard | -- | -- | |
| Hill William | $5,000 | -- | |
| Stewart Harold C | $4,500 | -- | |
| P | -- | -- | |
| Montgomery Kenneth Lee | -- | -- | |
| Hight Clarence | $6,400 | -- | |
| Hieght Willie Mae | $8,000 | -- | |
| Dempsey Ray | $4,500 | -- | |
| Morgan Jackson D | $3,000 | -- | |
| Morgan B C | -- | -- |
Source: Public Records
Tax History Compared to Growth
Tax History
| Year | Tax Paid | Tax Assessment Tax Assessment Total Assessment is a certain percentage of the fair market value that is determined by local assessors to be the total taxable value of land and additions on the property. | Land | Improvement |
|---|---|---|---|---|
| 2024 | $186 | $28,935 | $7,788 | $21,147 |
| 2023 | $183 | $27,438 | $7,080 | $20,358 |
| 2022 | $189 | $22,834 | $5,664 | $17,170 |
| 2021 | $193 | $21,239 | $5,664 | $15,575 |
| 2020 | $196 | $19,212 | $4,425 | $14,787 |
| 2019 | $193 | $17,933 | $4,425 | $13,508 |
| 2018 | $193 | $17,004 | $4,425 | $12,579 |
| 2017 | $193 | $14,189 | $2,100 | $12,089 |
| 2016 | $194 | $13,810 | $2,080 | $11,730 |
| 2015 | $171 | $13,810 | $2,080 | $11,730 |
| 2014 | $171 | $13,810 | $2,080 | $11,730 |
Source: Public Records
Map
Nearby Homes
- 4 E 15th St SW
- 1502 Spring Creek St SW
- 39 E 16th St SW
- 414 E 17th St SW
- 170 E 11th St SW
- 1705 Olmstead St SW
- 000 E Oglethorpe Hwy
- 168 E 11th St SE
- 162 E 11th St SE
- 164 E 11th St SE
- 31 Notasulga Dr SW
- 166 E 11th St SW
- 106 E 14th St SW
- 2 E 10th St SW
- 9 Eastridge Ct SW
- 1314 E 2nd Ave SE
- 304 E 19th St SW
- 211 E 11th St SE
- 1410 Spring Creek St SW
- 205 E 15th St SW
- 203 E 15th St SW
- 201 E 15th St SW
- 1408 Spring Creek St SW
- 1406 Spring Creek St SW
- 301 E 15th St SW
- 1405 Spring Creek St SW
- 2 E 15th St SW
- E E 15th St SW
- 302 E 14th St SW
- 303 E 15th St SW
- 304 E 14th St SW
- 306 E 14th St SW
- 1407 Maple Ave SW
- 1411 Maple Ave SW
- 402 E 14th St SW
- 1405 Maple Ave SW
- 305 E 15th St SW
- 404 E 14th St SW