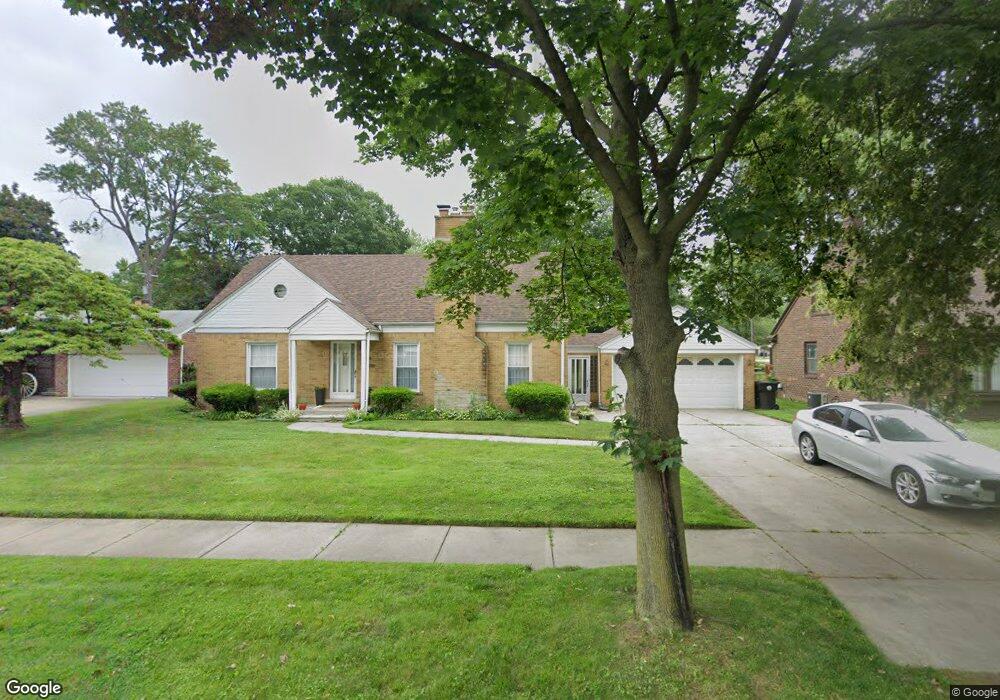
14122 Farley Unit Bldg-Unit Redford, MI 48239
Estimated Value: $267,000 - $310,000
Studio
3
Baths
1,773
Sq Ft
$159/Sq Ft
Est. Value
About This Home
This home is located at 14122 Farley Unit Bldg-Unit, Redford, MI 48239 and is currently estimated at $281,588, approximately $158 per square foot. 14122 Farley Unit Bldg-Unit is a home located in Wayne County with nearby schools including John D. Pierce Middle School, Lee M. Thurston High School, and Detroit Leadership Academy.
Ownership History
Date
Name
Owned For
Owner Type
Purchase Details
Closed on
May 31, 2022
Sold by
Robinson Lisa S
Bought by
Robinson Lisa S
Current Estimated Value
Purchase Details
Closed on
Jul 27, 2018
Sold by
Anderson Angela
Bought by
Robinson Lisa
Purchase Details
Closed on
May 12, 2011
Sold by
Bac Home Loans Servicing Lp
Bought by
Federal National Mortgage Association
Purchase Details
Closed on
Jan 27, 2011
Sold by
Johnson Annetta
Bought by
Bac Home Loans Servicing Lp
Purchase Details
Closed on
Mar 30, 2007
Sold by
Moran Renee J
Bought by
Johnson Annetta
Create a Home Valuation Report for This Property
The Home Valuation Report is an in-depth analysis detailing your home's value as well as a comparison with similar homes in the area
Home Values in the Area
Average Home Value in this Area
Purchase History
| Date | Buyer | Sale Price | Title Company |
|---|---|---|---|
| Robinson Lisa S | -- | Land Title | |
| Robinson Lisa | $155,000 | None Available | |
| Federal National Mortgage Association | -- | None Available | |
| Bac Home Loans Servicing Lp | $225,723 | None Available | |
| Johnson Annetta | $190,000 | Multiple |
Source: Public Records
Tax History
| Year | Tax Paid | Tax Assessment Tax Assessment Total Assessment is a certain percentage of the fair market value that is determined by local assessors to be the total taxable value of land and additions on the property. | Land | Improvement |
|---|---|---|---|---|
| 2025 | $1,859 | $123,400 | $0 | $0 |
| 2024 | $1,809 | $115,400 | $0 | $0 |
| 2023 | $1,733 | $103,700 | $0 | $0 |
| 2022 | $4,830 | $92,100 | $0 | $0 |
| 2021 | $4,693 | $85,200 | $0 | $0 |
| 2020 | $4,626 | $74,400 | $0 | $0 |
| 2019 | $4,522 | $69,300 | $0 | $0 |
| 2018 | $1,008 | $60,000 | $0 | $0 |
| 2017 | $3,486 | $56,400 | $0 | $0 |
| 2016 | $2,717 | $53,000 | $0 | $0 |
| 2015 | $4,232 | $47,900 | $0 | $0 |
| 2013 | $4,100 | $42,000 | $0 | $0 |
| 2012 | $2,497 | $46,700 | $8,100 | $38,600 |
Source: Public Records
Map
Nearby Homes