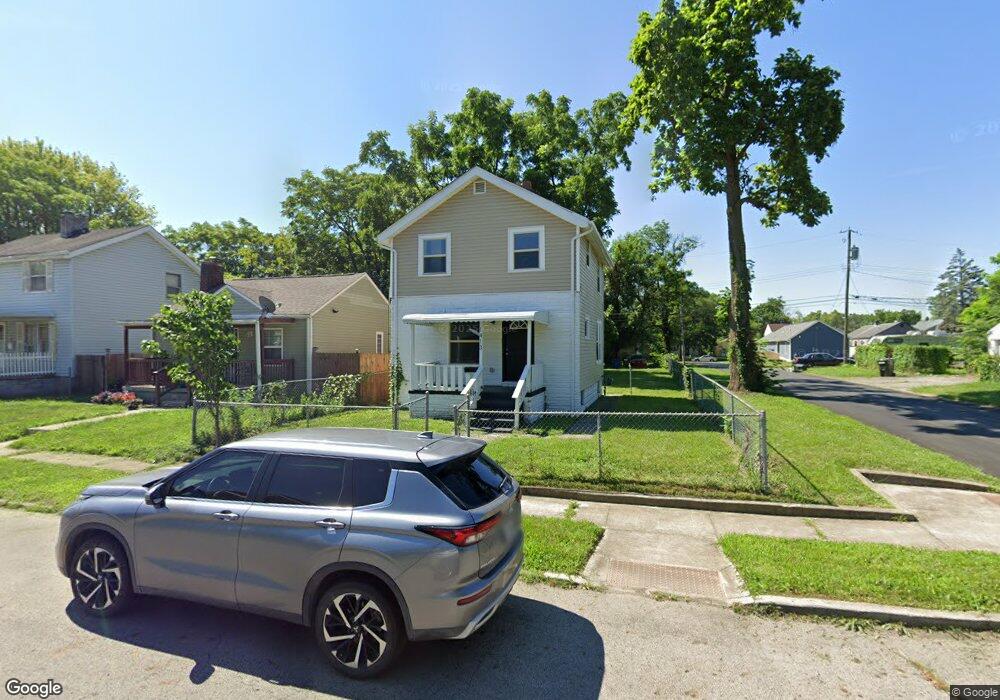
1413 E 19th Ave Columbus, OH 43211
South Linden NeighborhoodEstimated Value: $72,000 - $120,890
3
Beds
2
Baths
966
Sq Ft
$105/Sq Ft
Est. Value
About This Home
This home is located at 1413 E 19th Ave, Columbus, OH 43211 and is currently estimated at $100,973, approximately $104 per square foot. 1413 E 19th Ave is a home located in Franklin County with nearby schools including Windsor Stem Acadmey, Linden-Mckinley Stem School On Arcadia, and North Columbus Preparatory Academy.
Ownership History
Date
Name
Owned For
Owner Type
Purchase Details
Closed on
Feb 8, 2022
Sold by
Vernard Wallace
Bought by
Coker Enterprise Llc
Current Estimated Value
Purchase Details
Closed on
Feb 7, 2022
Sold by
Rhodes Iii Robert O
Bought by
Wallace Vernard
Purchase Details
Closed on
Aug 25, 2009
Sold by
Palmer Max
Bought by
Rhodes Robert O
Purchase Details
Closed on
Sep 11, 2008
Sold by
Short Aaron
Bought by
Palmer Max
Purchase Details
Closed on
Sep 19, 2007
Sold by
Residential Funding Co Llc
Bought by
Short Aaron
Purchase Details
Closed on
Feb 7, 2007
Sold by
Campbell Jerimiah and Homecomings Financial Network
Bought by
Residential Funding Co Llc
Purchase Details
Closed on
Sep 24, 1990
Bought by
Campbell Jeremiah
Purchase Details
Closed on
Jul 24, 1990
Purchase Details
Closed on
Dec 19, 1989
Create a Home Valuation Report for This Property
The Home Valuation Report is an in-depth analysis detailing your home's value as well as a comparison with similar homes in the area
Home Values in the Area
Average Home Value in this Area
Purchase History
| Date | Buyer | Sale Price | Title Company |
|---|---|---|---|
| Coker Enterprise Llc | $65,000 | New Title Company Name | |
| Wallace Vernard | $55,000 | New Title Company Name | |
| Rhodes Robert O | $5,000 | None Available | |
| Palmer Max | $5,900 | Cornerstone Title Services | |
| Short Aaron | $5,900 | Cornerstone Title Services | |
| Residential Funding Co Llc | $32,000 | None Available | |
| Campbell Jeremiah | $29,000 | -- | |
| -- | -- | -- | |
| -- | -- | -- |
Source: Public Records
Tax History
| Year | Tax Paid | Tax Assessment Tax Assessment Total Assessment is a certain percentage of the fair market value that is determined by local assessors to be the total taxable value of land and additions on the property. | Land | Improvement |
|---|---|---|---|---|
| 2025 | $1,536 | $30,240 | $5,740 | $24,500 |
| 2024 | $1,536 | $30,240 | $5,740 | $24,500 |
| 2023 | $1,348 | $29,790 | $5,740 | $24,050 |
| 2022 | $1,496 | $8,620 | $2,490 | $6,130 |
| 2021 | $1,139 | $8,620 | $2,490 | $6,130 |
| 2020 | $902 | $8,620 | $2,490 | $6,130 |
| 2019 | $975 | $6,970 | $2,070 | $4,900 |
| 2018 | $216 | $6,970 | $2,070 | $4,900 |
| 2017 | $573 | $9,210 | $2,070 | $7,140 |
| 2016 | $1,321 | $12,990 | $2,660 | $10,330 |
| 2015 | $402 | $12,990 | $2,660 | $10,330 |
| 2014 | $805 | $12,990 | $2,660 | $10,330 |
| 2013 | $441 | $14,420 | $2,940 | $11,480 |
Source: Public Records
Map
Nearby Homes
- 1315 E 18th Ave
- 1386 E 22nd Ave
- 1371 E 23rd Ave
- 1258 E 21st Ave
- 1272 E 15th Ave
- 1249-1251 E 15th Ave
- 1251 E 23rd Ave
- 1335 E 25th Ave Unit 337
- 1673 Cleveland Ave
- 1157-1159 E 18th Ave
- 0 Windsor Ave
- 1129 E 17th Ave
- 1136 E 21st Ave
- 1111-1113 E 16th Ave
- 1301 E 26th Ave
- 1363 Duxberry Ave
- 0 Delbert Rd Unit 225030362
- 1366 Duxberry Ave
- 1423 E Maynard Ave
- 1129 E 23rd Ave Unit 1129 - 1131
- 1419 E 19th Ave
- 1423 E 19th Ave
- 1401 E 19th Ave
- 1429 E 19th Ave
- 1397 E 19th Ave
- 1433 E 19th Ave
- 1391 E 19th Ave
- 1406 E 18th Ave
- 1416 E 19th Ave
- 1420 E 19th Ave
- 1418 E 18th Ave
- 1387 E 19th Ave
- 1428 E 19th Ave
- 1404 E 19th Ave
- 1388 E 18th Ave
- 1424 E 18th Ave
- 1392 E 18th Ave
- 1443 E 19th Ave
- 1432 E 19th Ave
- 1382 E 18th Ave
Your Personal Tour Guide
Ask me questions while you tour the home.