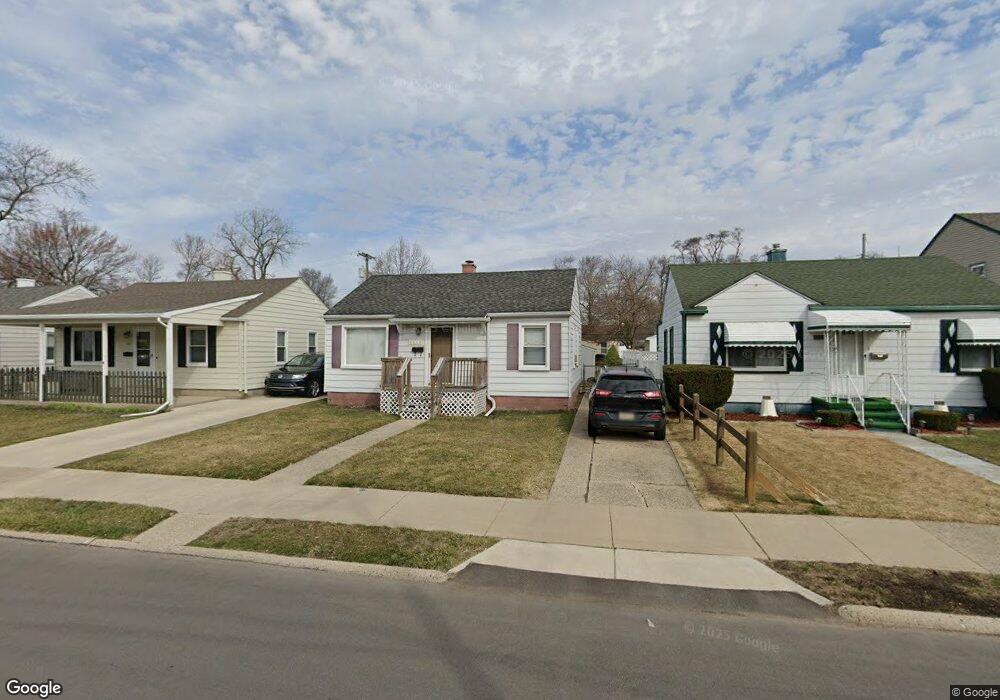
1413 E Breckenridge St Ferndale, MI 48220
Estimated Value: $168,790 - $188,000
2
Beds
1
Bath
800
Sq Ft
$219/Sq Ft
Est. Value
About This Home
This home is located at 1413 E Breckenridge St, Ferndale, MI 48220 and is currently estimated at $175,198, approximately $218 per square foot. 1413 E Breckenridge St is a home located in Oakland County with nearby schools including Hazel Park Junior High School and Hazel Park High School.
Ownership History
Date
Name
Owned For
Owner Type
Purchase Details
Closed on
Oct 26, 2021
Sold by
Lenaway Family Trust
Bought by
Anderson Diane
Current Estimated Value
Home Financials for this Owner
Home Financials are based on the most recent Mortgage that was taken out on this home.
Original Mortgage
$129,600
Outstanding Balance
$118,040
Interest Rate
3.01%
Mortgage Type
New Conventional
Estimated Equity
$57,158
Purchase Details
Closed on
Jun 24, 2021
Sold by
Lenaway Roy Robert and Lenaway Mary Catherine
Bought by
The Lenaway Family Trust
Purchase Details
Closed on
Nov 16, 2011
Sold by
Mahar John P and Mahar Danielle D
Bought by
Lenaway Mary and Lenaway Roy R
Purchase Details
Closed on
Jun 24, 2005
Sold by
Pearson Casey
Bought by
Mahar John P and Smallbone Danielle D
Purchase Details
Closed on
Oct 24, 2003
Sold by
Vancleave Kevin
Bought by
Pearson Casey
Purchase Details
Closed on
Jun 20, 2000
Sold by
Caughey Gerald W
Bought by
Vancleave Kevin
Create a Home Valuation Report for This Property
The Home Valuation Report is an in-depth analysis detailing your home's value as well as a comparison with similar homes in the area
Home Values in the Area
Average Home Value in this Area
Purchase History
| Date | Buyer | Sale Price | Title Company |
|---|---|---|---|
| Anderson Diane | $14,000 | None Listed On Document | |
| The Lenaway Family Trust | -- | None Available | |
| Lenaway Mary | $23,000 | Bell Title Agency | |
| Mahar John P | $119,500 | Metropolitan Title Company | |
| Pearson Casey | $108,000 | Metropolitan Title Company | |
| Vancleave Kevin | $77,000 | -- |
Source: Public Records
Mortgage History
| Date | Status | Borrower | Loan Amount |
|---|---|---|---|
| Open | Anderson Diane | $129,600 |
Source: Public Records
Tax History
| Year | Tax Paid | Tax Assessment Tax Assessment Total Assessment is a certain percentage of the fair market value that is determined by local assessors to be the total taxable value of land and additions on the property. | Land | Improvement |
|---|---|---|---|---|
| 2025 | $4,832 | $75,060 | $0 | $0 |
| 2024 | $4,698 | $70,660 | $0 | $0 |
| 2023 | $3,745 | $65,790 | $0 | $0 |
| 2022 | $3,733 | $57,510 | $0 | $0 |
| 2021 | $1,631 | $51,860 | $0 | $0 |
| 2020 | $1,571 | $44,070 | $0 | $0 |
| 2019 | $1,578 | $35,920 | $0 | $0 |
| 2018 | $1,552 | $27,590 | $0 | $0 |
| 2017 | $1,522 | $25,740 | $0 | $0 |
| 2016 | $1,503 | $22,430 | $0 | $0 |
| 2015 | -- | $18,840 | $0 | $0 |
| 2014 | -- | $16,010 | $0 | $0 |
| 2011 | -- | $25,640 | $0 | $0 |
Source: Public Records
Map
Nearby Homes
- 2157 Symes St
- 1130 E Breckenridge St
- 2128 Romeo St
- 1971 Leitch Rd
- 1032 E Breckenridge St
- 1986 Leitch Rd
- 1184 E Troy St
- 1054 E Troy St
- 2411 Harris St
- 2146 Martin Rd
- 1939 Almont St
- 2636 Harris St
- 2105 Manatee Ave
- 1985 Pilgrim St
- 1489 Woodward Heights
- 23067 Stauber Ave
- 1942 E Troy St
- 1851 Moorhouse St
- 2808 Goodrich St
- 490 E Cambourne St
- 1405 E Breckenridge St
- 1421 E Breckenridge St
- 1351 E Breckenridge St
- 1429 E Breckenridge St
- 1406 E Cambourne St
- 1416 E Cambourne St
- 1424 E Cambourne St
- 1341 E Breckenridge St
- 1435 E Breckenridge St
- 1333 E Breckenridge St
- 1360 E Cambourne St
- 1340 E Cambourne St
- 1412 E Breckenridge St
- 1420 E Breckenridge St
- 1404 E Breckenridge St
- 1436 E Cambourne St
- 1428 E Breckenridge St
- 1436 E Breckenridge St
- 1350 E Breckenridge St
- 1325 E Breckenridge St Unit Bldg-Unit
Your Personal Tour Guide
Ask me questions while you tour the home.