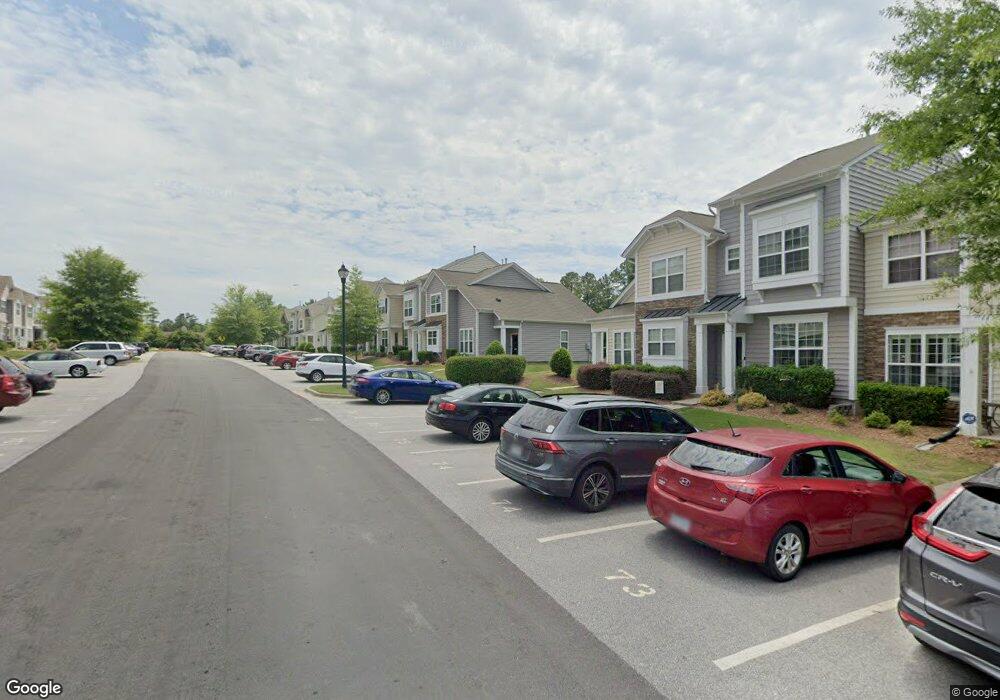
1413 Grace Point Rd Unit 77 Morrisville, NC 27560
Estimated Value: $358,000 - $374,000
3
Beds
3
Baths
1,460
Sq Ft
$253/Sq Ft
Est. Value
About This Home
This home is located at 1413 Grace Point Rd Unit 77, Morrisville, NC 27560 and is currently estimated at $369,171, approximately $252 per square foot. 1413 Grace Point Rd Unit 77 is a home located in Wake County with nearby schools including Parkside Elementary School, Alston Ridge Middle School, and Panther Creek High School.
Ownership History
Date
Name
Owned For
Owner Type
Purchase Details
Closed on
Sep 29, 2021
Sold by
Millett Elisia P
Bought by
Patil Dayanand Shamrao and Patil Asmita Dayanand
Current Estimated Value
Home Financials for this Owner
Home Financials are based on the most recent Mortgage that was taken out on this home.
Original Mortgage
$298,800
Outstanding Balance
$272,478
Interest Rate
2.8%
Mortgage Type
New Conventional
Estimated Equity
$96,693
Purchase Details
Closed on
Feb 17, 2014
Sold by
Dwiggins Amber M and Dwiggins Jason David
Bought by
Millett Elisia P
Purchase Details
Closed on
Feb 22, 2012
Sold by
Standard Pacific Of The Carolinas Llc
Bought by
Millett Amber L
Home Financials for this Owner
Home Financials are based on the most recent Mortgage that was taken out on this home.
Original Mortgage
$155,540
Interest Rate
3.91%
Mortgage Type
FHA
Create a Home Valuation Report for This Property
The Home Valuation Report is an in-depth analysis detailing your home's value as well as a comparison with similar homes in the area
Home Values in the Area
Average Home Value in this Area
Purchase History
| Date | Buyer | Sale Price | Title Company |
|---|---|---|---|
| Patil Dayanand Shamrao | $332,000 | None Available | |
| Millett Elisia P | $149,500 | None Available | |
| Millett Amber L | $160,000 | None Available |
Source: Public Records
Mortgage History
| Date | Status | Borrower | Loan Amount |
|---|---|---|---|
| Open | Patil Dayanand Shamrao | $298,800 | |
| Previous Owner | Millett Amber L | $155,540 |
Source: Public Records
Tax History Compared to Growth
Tax History
| Year | Tax Paid | Tax Assessment Tax Assessment Total Assessment is a certain percentage of the fair market value that is determined by local assessors to be the total taxable value of land and additions on the property. | Land | Improvement |
|---|---|---|---|---|
| 2025 | $3,275 | $372,469 | $95,000 | $277,469 |
| 2024 | $3,261 | $372,469 | $95,000 | $277,469 |
| 2023 | $2,528 | $239,504 | $63,000 | $176,504 |
| 2022 | $2,438 | $239,504 | $63,000 | $176,504 |
| 2021 | $2,332 | $239,504 | $63,000 | $176,504 |
| 2020 | $2,319 | $239,504 | $63,000 | $176,504 |
| 2019 | $1,965 | $173,945 | $42,000 | $131,945 |
| 2018 | $1,849 | $173,945 | $42,000 | $131,945 |
| 2017 | $1,781 | $173,945 | $42,000 | $131,945 |
| 2016 | $1,743 | $182,032 | $50,000 | $132,032 |
| 2015 | $1,763 | $170,138 | $36,000 | $134,138 |
| 2014 | $1,679 | $170,138 | $36,000 | $134,138 |
Source: Public Records
Map
Nearby Homes
- 401 Stockton Gorge Rd
- 309 Colwick Ln
- 421 Hamlet Park Dr
- 101 Hamlet Park Dr
- 2032 Kirkhaven Rd
- 1135 Forest Willow Ln
- 2205 Kirkhaven Rd
- 2108 Junewood Ln
- 0 Lot 2 Church St
- 0 Lot 1 Church St
- 0 Lot 5 Church St
- 0 Lot 6 Church St
- 0 Lot 4 Church St
- 508 Durants Neck Ln
- 204 Concordia Woods Dr
- 1025 Historic Cir
- 1404 Legendary Ln
- 142 Brentfield Loop
- 605 Courthouse Dr
- 784 Newstead Way
- 1413 Grace Point Rd
- 1411 Grace Point Rd Unit 78
- 1411 Grace Point Rd
- 1409 Grace Point Rd Unit 79
- 1501 Grace Point Rd
- 1501 Grace Point Rd Unit 76
- 1407 Grace Point Rd Unit 80
- 1503 Grace Point Rd
- 1503 Grace Point Rd Unit 75
- 1405 Grace Point Rd Unit 81
- 1505 Grace Point Rd
- 1505 Grace Point Rd Unit 74
- 1403 Grace Point Rd Unit 82
- 1403 Grace Point Rd
- 1507 Grace Point Rd
- 1507 Grace Point Rd Unit 73
- 1401 Grace Point Rd Unit 83
- 1401 Grace Point Rd
- 1404 Grace Point Rd Unit 100
- 1406 Grace Point Rd