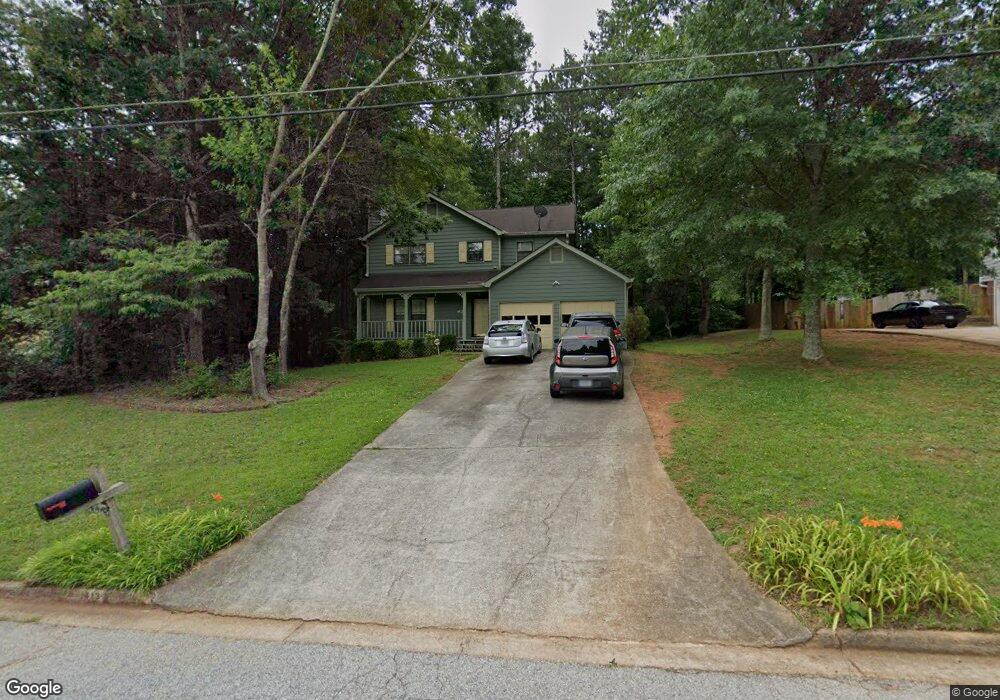
1413 Hillside Place SE Unit 1 Conyers, GA 30094
Estimated Value: $263,000 - $285,000
3
Beds
5
Baths
2,100
Sq Ft
$130/Sq Ft
Est. Value
About This Home
This home is located at 1413 Hillside Place SE Unit 1, Conyers, GA 30094 and is currently estimated at $272,478, approximately $129 per square foot. 1413 Hillside Place SE Unit 1 is a home located in Rockdale County with nearby schools including Sims Elementary School, Edwards Middle School, and Heritage High School.
Ownership History
Date
Name
Owned For
Owner Type
Purchase Details
Closed on
Feb 6, 2007
Sold by
Anglin Christopher and Anglin Joanna
Bought by
Kimble Joy
Current Estimated Value
Home Financials for this Owner
Home Financials are based on the most recent Mortgage that was taken out on this home.
Original Mortgage
$108,000
Outstanding Balance
$64,399
Interest Rate
6.08%
Mortgage Type
New Conventional
Estimated Equity
$208,079
Purchase Details
Closed on
Apr 18, 2003
Sold by
Dunlop Duncan R
Bought by
Anglin Christopher and Anglin Joann
Home Financials for this Owner
Home Financials are based on the most recent Mortgage that was taken out on this home.
Original Mortgage
$126,022
Interest Rate
5.6%
Mortgage Type
FHA
Purchase Details
Closed on
Dec 30, 1998
Sold by
Kilroy Corinne
Bought by
Dunlap Duncan R
Home Financials for this Owner
Home Financials are based on the most recent Mortgage that was taken out on this home.
Original Mortgage
$103,630
Interest Rate
6.87%
Mortgage Type
FHA
Create a Home Valuation Report for This Property
The Home Valuation Report is an in-depth analysis detailing your home's value as well as a comparison with similar homes in the area
Home Values in the Area
Average Home Value in this Area
Purchase History
| Date | Buyer | Sale Price | Title Company |
|---|---|---|---|
| Kimble Joy | $135,000 | -- | |
| Anglin Christopher | $128,000 | -- | |
| Dunlap Duncan R | $104,500 | -- |
Source: Public Records
Mortgage History
| Date | Status | Borrower | Loan Amount |
|---|---|---|---|
| Open | Kimble Joy | $108,000 | |
| Previous Owner | Anglin Christopher | $126,022 | |
| Previous Owner | Dunlap Duncan R | $103,630 |
Source: Public Records
Tax History Compared to Growth
Tax History
| Year | Tax Paid | Tax Assessment Tax Assessment Total Assessment is a certain percentage of the fair market value that is determined by local assessors to be the total taxable value of land and additions on the property. | Land | Improvement |
|---|---|---|---|---|
| 2024 | $2,659 | $110,120 | $20,520 | $89,600 |
| 2023 | $1,998 | $87,720 | $21,200 | $66,520 |
| 2022 | $1,514 | $68,880 | $16,520 | $52,360 |
| 2021 | $1,263 | $56,240 | $10,800 | $45,440 |
| 2020 | $1,144 | $52,560 | $10,000 | $42,560 |
| 2019 | $819 | $41,080 | $6,000 | $35,080 |
| 2018 | $825 | $41,080 | $6,000 | $35,080 |
| 2017 | $755 | $38,520 | $6,000 | $32,520 |
| 2016 | $513 | $32,120 | $6,000 | $26,120 |
| 2015 | $490 | $31,280 | $4,600 | $26,680 |
| 2014 | $443 | $31,280 | $4,600 | $26,680 |
| 2013 | -- | $37,960 | $8,920 | $29,040 |
Source: Public Records
Map
Nearby Homes
- 1420 Hillside Place SE
- 1508 Hillside Dr SE
- 1511 Hillside Dr SE
- 2617 Laurel Woods Ln SE Unit 3
- 2717 Stanton Woods Dr SE
- 1601 Creek Crossing SE
- 2631 Rolling Hills Way SE
- 574 Almand Branch Rd SE Unit 1
- 2537 Lennox Rd SE
- 340 Windsor Walk SE
- 2851 Stanton Rd SE
- 2608 Downing Park Dr SE
- 309 Windsor Walk SE Unit 1
- 549 Greenview Ave SE
- 2910 Stanton Rd SE
- 250 Smile Dr SE
- 784 Stieff Ct SE
- 693 Deering Rd SE
- 2464 Lennox Rd SE
- 1920 Logan Ln
- 1415 Hillside Place SE
- 1411 Hillside Place SE
- 1411 Hillside Place SE Unit /65
- 0 Hillside Place SE Unit 8717124
- 0 Hillside Place SE Unit 8245724
- 0 Hillside Place SE Unit 9067525
- 0 Hillside Place SE Unit 3215724
- 0 Hillside Place SE Unit 7440645
- 0 Hillside Place SE Unit 7544874
- 0 Hillside Place SE Unit 8041231
- 0 Hillside Place SE Unit 8239076
- 0 Hillside Place SE Unit 8562921
- 0 Hillside Place SE Unit /65
- 1417 Hillside Place SE Unit 1
- 1506 Hillside Dr SE Unit 2
- 1409 Hillside Place SE
- 1510 Hillside Dr SE
- 1504 Hillside Dr SE
- 1414 Hillside Place SE
- 1416 Hillside Place SE