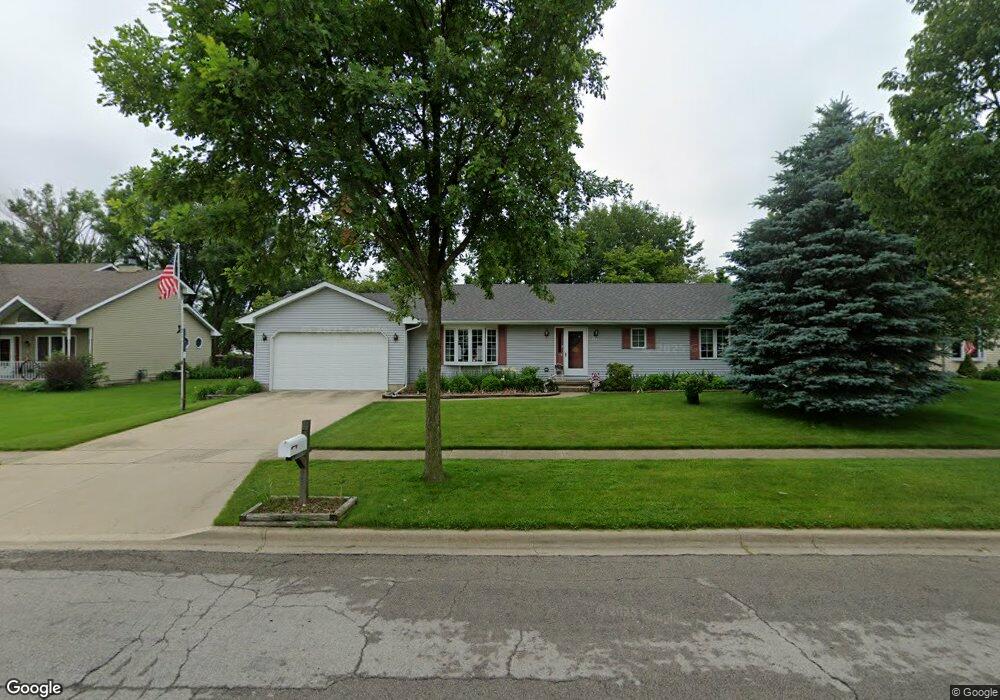
1413 John St Sycamore, IL 60178
Estimated Value: $330,714 - $360,000
4
Beds
2
Baths
1,533
Sq Ft
$223/Sq Ft
Est. Value
About This Home
This home is located at 1413 John St, Sycamore, IL 60178 and is currently estimated at $341,179, approximately $222 per square foot. 1413 John St is a home located in DeKalb County with nearby schools including Sycamore High School, Cornerstone Christian Academy, and St Mary's Catholic School.
Create a Home Valuation Report for This Property
The Home Valuation Report is an in-depth analysis detailing your home's value as well as a comparison with similar homes in the area
Home Values in the Area
Average Home Value in this Area
Tax History
| Year | Tax Paid | Tax Assessment Tax Assessment Total Assessment is a certain percentage of the fair market value that is determined by local assessors to be the total taxable value of land and additions on the property. | Land | Improvement |
|---|---|---|---|---|
| 2025 | $6,675 | $97,093 | $21,753 | $75,340 |
| 2024 | $6,675 | $91,287 | $20,452 | $70,835 |
| 2023 | $6,203 | $83,360 | $18,676 | $64,684 |
| 2022 | $6,203 | $76,456 | $17,129 | $59,327 |
| 2021 | $5,864 | $71,777 | $16,081 | $55,696 |
| 2020 | $5,766 | $70,013 | $15,686 | $54,327 |
| 2019 | $5,657 | $68,479 | $15,342 | $53,137 |
| 2018 | $5,540 | $66,400 | $14,876 | $51,524 |
| 2017 | $5,376 | $63,772 | $14,287 | $49,485 |
| 2016 | $5,212 | $60,863 | $13,635 | $47,228 |
| 2015 | -- | $57,283 | $12,833 | $44,450 |
| 2014 | -- | $54,395 | $12,186 | $42,209 |
| 2013 | -- | $55,437 | $12,419 | $43,018 |
Source: Public Records
Map
Nearby Homes
- 734 Independence Ave
- Rt 23 and Plank Rd Rt 23 and Plank Rd Rd
- 68 Kloe Ln Unit 68
- 1618 Pine Trail
- 1818 Brickville Rd
- 405 Thomas Dr
- 1321 Florence Dr
- 607 Clayton Cir
- 637 Stonegate Dr Unit CO
- 315 North Ave
- Lot 86 Merry Oaks Dr
- Lot 97 Merry Oaks Dr
- 64 Kloe Ln Unit 64
- 60 Kloe Ln Unit 60
- 1716 Tewksberry Dr
- 52 Kloe Ln Unit 52
- 18 Kloe Ln Unit 18
- 45 Briden Ln Unit 45
- 1723 Whittemore Dr
- 1064 Rose Dr
Your Personal Tour Guide
Ask me questions while you tour the home.