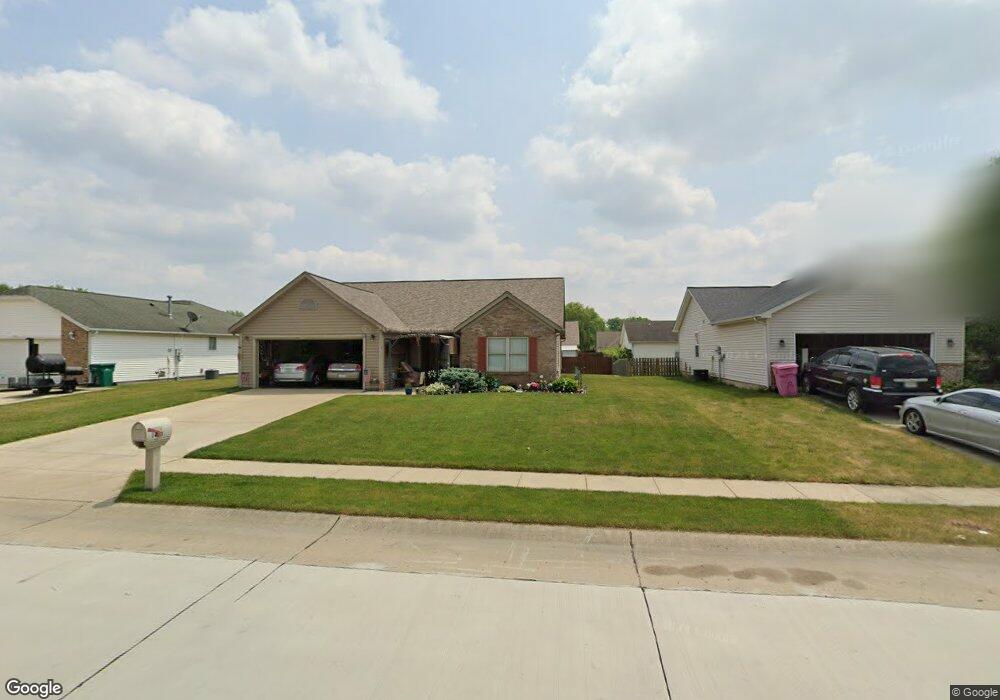
1413 Roundtable Dr West Lafayette, IN 47906
Estimated Value: $282,000 - $296,000
3
Beds
2
Baths
1,571
Sq Ft
$186/Sq Ft
Est. Value
About This Home
This home is located at 1413 Roundtable Dr, West Lafayette, IN 47906 and is currently estimated at $292,239, approximately $186 per square foot. 1413 Roundtable Dr is a home located in Tippecanoe County with nearby schools including Burnett Creek Elementary School, Battle Ground Middle School, and William Henry Harrison High School.
Ownership History
Date
Name
Owned For
Owner Type
Purchase Details
Closed on
Dec 18, 2009
Sold by
Zobrist Corinne F
Bought by
Auberry Thomas J and Auberry Toni
Current Estimated Value
Purchase Details
Closed on
Mar 3, 2004
Sold by
Zobrist William Howard
Bought by
Zobrist Corinne F
Purchase Details
Closed on
Oct 29, 2003
Sold by
Walker Eleanore F and Hartman Joseph T
Bought by
Zobrist William Howard and Zobrist Corinne F
Purchase Details
Closed on
Aug 1, 2003
Sold by
Huff Eric L and Huff Caroline R
Bought by
Walker Eleanore F and Hartman Joseph T
Purchase Details
Closed on
Feb 25, 2002
Sold by
Gick Builders Inc
Bought by
Huff Eric L and Huff Caroline R
Home Financials for this Owner
Home Financials are based on the most recent Mortgage that was taken out on this home.
Original Mortgage
$120,175
Interest Rate
7.14%
Purchase Details
Closed on
May 16, 2001
Sold by
Luxhart Corp
Bought by
Gick Builders Inc
Create a Home Valuation Report for This Property
The Home Valuation Report is an in-depth analysis detailing your home's value as well as a comparison with similar homes in the area
Home Values in the Area
Average Home Value in this Area
Purchase History
| Date | Buyer | Sale Price | Title Company |
|---|---|---|---|
| Auberry Thomas J | -- | None Available | |
| Zobrist Corinne F | -- | -- | |
| Zobrist William Howard | -- | -- | |
| Walker Eleanore F | -- | -- | |
| Huff Eric L | -- | -- | |
| Gick Builders Inc | -- | -- |
Source: Public Records
Mortgage History
| Date | Status | Borrower | Loan Amount |
|---|---|---|---|
| Previous Owner | Huff Eric L | $120,175 |
Source: Public Records
Tax History Compared to Growth
Tax History
| Year | Tax Paid | Tax Assessment Tax Assessment Total Assessment is a certain percentage of the fair market value that is determined by local assessors to be the total taxable value of land and additions on the property. | Land | Improvement |
|---|---|---|---|---|
| 2024 | $1,491 | $220,400 | $32,900 | $187,500 |
| 2023 | $1,301 | $203,100 | $32,900 | $170,200 |
| 2022 | $1,170 | $173,000 | $32,900 | $140,100 |
| 2021 | $954 | $153,300 | $32,900 | $120,400 |
| 2020 | $840 | $138,900 | $32,900 | $106,000 |
| 2019 | $754 | $132,000 | $32,900 | $99,100 |
| 2018 | $646 | $121,000 | $30,000 | $91,000 |
| 2017 | $671 | $124,100 | $30,000 | $94,100 |
| 2016 | $651 | $122,400 | $30,000 | $92,400 |
| 2014 | $628 | $120,600 | $30,000 | $90,600 |
| 2013 | $626 | $116,700 | $30,000 | $86,700 |
Source: Public Records
Map
Nearby Homes
- 1500 Roundtable Dr
- 1512 Shining Armor Ln
- 4440 N Candlewick Ln
- 4446 Crossbow Ct
- 4321 Mcclellan Ln
- 34 Lee Ct
- 1632 Solemar Dr
- 1467 Solemar Dr
- 1408 Solemar Dr
- 1380 Solemar Dr
- 4880 N 225 W
- 1050 Edgerton St
- 1044 Roxboro St
- 242 W Big Pine Dr
- 3519 Senior Place
- 3437 Covington St
- 2330 Centennial Ct W
- 4948 Taft Rd
- 4801 Homewood Dr
- 65 Hayloft (41 Am) Dr
- 1417 Roundtable Dr
- 1409 Roundtable Dr
- 1414 Lionheart Ln
- 1418 Lionheart Ln
- 1410 Lionheart Ln
- 1405 Roundtable Dr
- 1421 Roundtable Dr
- 1412 Roundtable Dr
- 1406 Lionheart Ln
- 1416 Roundtable Dr
- 1408 Roundtable Dr
- 1422 Lionheart Ln
- 1401 Roundtable Dr
- 1402 Lionheart Ln
- 1415 Lionheart Ln
- 1400 Roundtable Dr
- 1419 Lionheart Ln
- 1411 Lionheart Ln
- 1331 Roundtable Dr
- 1411 Crusade Dr