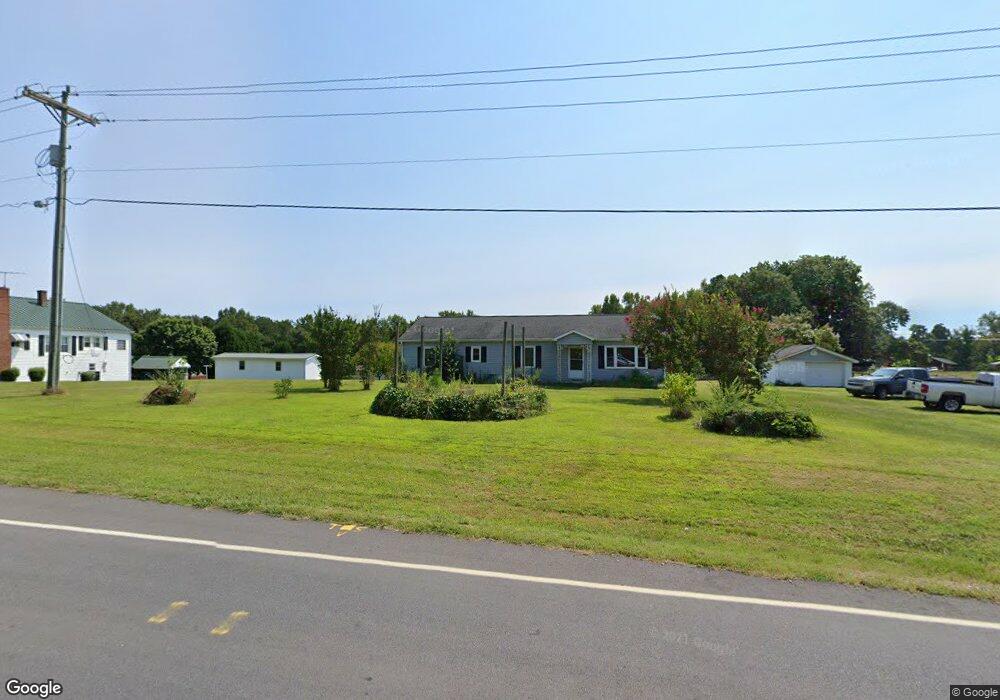
1413 S Battleground Ave Kings Mountain, NC 28086
Estimated Value: $240,590 - $289,000
--
Bed
--
Bath
1,620
Sq Ft
$168/Sq Ft
Est. Value
About This Home
This home is located at 1413 S Battleground Ave, Kings Mountain, NC 28086 and is currently estimated at $271,898, approximately $167 per square foot. 1413 S Battleground Ave is a home located in Cleveland County with nearby schools including Grover Elementary School, Kings Mountain Middle, and Kings Mountain Intermediate School.
Ownership History
Date
Name
Owned For
Owner Type
Purchase Details
Closed on
May 30, 2006
Sold by
Upton Earoid and Upton Mary
Bought by
Lambert Michael and Lambert Pacia
Current Estimated Value
Home Financials for this Owner
Home Financials are based on the most recent Mortgage that was taken out on this home.
Original Mortgage
$81,600
Outstanding Balance
$50,087
Interest Rate
7.37%
Mortgage Type
Assumption
Estimated Equity
$221,811
Purchase Details
Closed on
Dec 7, 2005
Sold by
Dertsche Bank National Trust Co
Bought by
Upton Harold
Home Financials for this Owner
Home Financials are based on the most recent Mortgage that was taken out on this home.
Original Mortgage
$72,000
Interest Rate
6.19%
Mortgage Type
Purchase Money Mortgage
Purchase Details
Closed on
May 10, 2005
Sold by
Brock & Scott Pllc
Bought by
Dentsche Bank Nationa Trust Company
Create a Home Valuation Report for This Property
The Home Valuation Report is an in-depth analysis detailing your home's value as well as a comparison with similar homes in the area
Home Values in the Area
Average Home Value in this Area
Purchase History
| Date | Buyer | Sale Price | Title Company |
|---|---|---|---|
| Lambert Michael | $102,000 | None Available | |
| Upton Harold | $73,500 | None Available | |
| Dentsche Bank Nationa Trust Company | $101,000 | None Available |
Source: Public Records
Mortgage History
| Date | Status | Borrower | Loan Amount |
|---|---|---|---|
| Open | Lambert Michael | $81,600 | |
| Previous Owner | Upton Harold | $72,000 |
Source: Public Records
Tax History Compared to Growth
Tax History
| Year | Tax Paid | Tax Assessment Tax Assessment Total Assessment is a certain percentage of the fair market value that is determined by local assessors to be the total taxable value of land and additions on the property. | Land | Improvement |
|---|---|---|---|---|
| 2025 | $1,161 | $188,802 | $84,641 | $104,161 |
| 2024 | $632 | $71,210 | $18,012 | $53,198 |
| 2023 | $630 | $71,210 | $18,012 | $53,198 |
| 2022 | $629 | $71,210 | $18,012 | $53,198 |
| 2021 | $630 | $71,210 | $18,012 | $53,198 |
| 2020 | $586 | $63,501 | $17,139 | $46,362 |
| 2019 | $586 | $63,501 | $17,139 | $46,362 |
| 2018 | $582 | $63,501 | $17,139 | $46,362 |
| 2017 | $579 | $63,501 | $17,139 | $46,362 |
| 2016 | $551 | $63,501 | $17,139 | $46,362 |
| 2015 | $586 | $68,093 | $15,581 | $52,512 |
| 2014 | $586 | $68,093 | $15,581 | $52,512 |
Source: Public Records
Map
Nearby Homes
- 209 Fairdale St
- 610 Margrace Rd
- 107 Connor Ct
- 1425 Bethlehem Rd
- 106 Raintree Dr
- 107 Arrowood Dr
- 107 Tara Terrace
- 163 Kipling Ln
- 180 Rosedale St
- 450 Dixon School Rd
- 130 Benton Rd
- 419 Brinkley Dr
- 412 Brinkley Dr
- 143 Parker Claire Ln
- 137 Parker Claire Ln
- 157 Parker Claire Ln
- 104 Parker Claire Ln
- 207 Parker Claire Ln
- 219 Parker Claire Ln
- 107 Frank Burns Way
- 1411 S Battleground Ave Unit 1
- 1411 S Battleground Ave Unit 2
- 1411 S Battleground Ave
- 1419 S Battleground Ave
- 1417 S Battleground Ave
- 1421 S Battleground Ave
- 1423 S Battleground Ave
- -TBD- S Battleground Ave
- 1407 S Battleground Ave
- 1407 S Battleground Ave
- 105 Pagan Rd
- 201 Mail Rd
- 206 Mail Rd
- 1355 Battleground Ave
- 643 Margrace Rd
- 105 Mail Rd
- 103 Fairdale St
- 111 Pagan Rd
- 102 Fairdale St
- 1363 S Battleground Ave