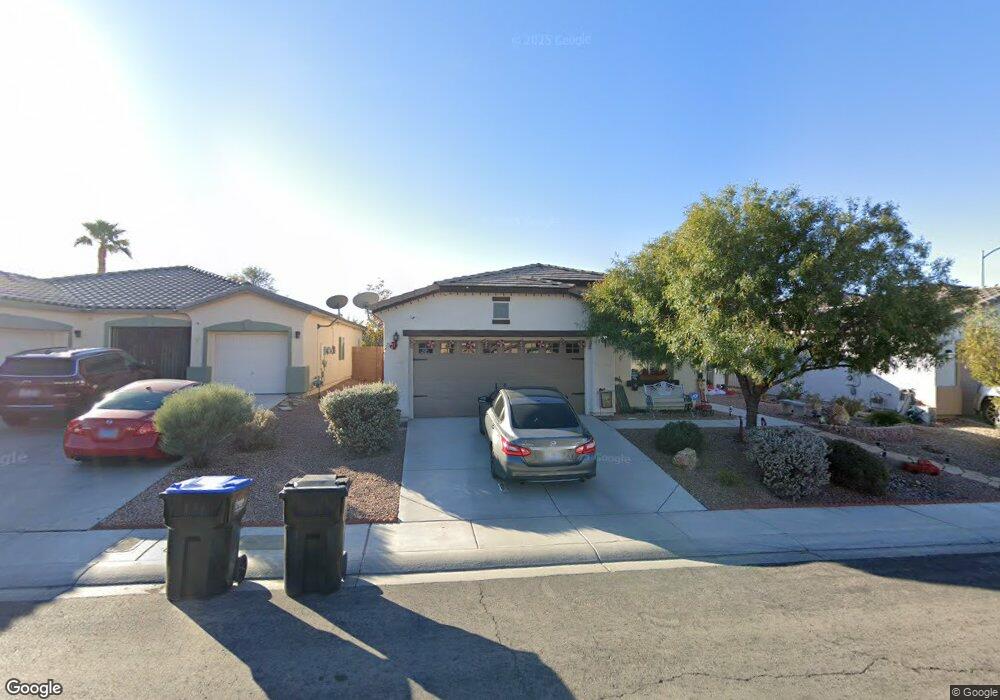
1413 Sagebrush Ranch Way Unit 3 North Las Vegas, NV 89081
Northridge NeighborhoodEstimated Value: $391,000 - $410,000
3
Beds
2
Baths
1,759
Sq Ft
$227/Sq Ft
Est. Value
About This Home
This home is located at 1413 Sagebrush Ranch Way Unit 3, North Las Vegas, NV 89081 and is currently estimated at $399,654, approximately $227 per square foot. 1413 Sagebrush Ranch Way Unit 3 is a home located in Clark County with nearby schools including Don E. Hayden Elementary School, Ruby Duncan Elementary School, and Carroll M. Johnston STEM Academy of Environmental Studies.
Ownership History
Date
Name
Owned For
Owner Type
Purchase Details
Closed on
Aug 4, 2023
Sold by
Raudenbush Robert R and Raudenbush Esther C
Bought by
Raudenbush Family Revocable Living Trust and Raudenbush
Current Estimated Value
Purchase Details
Closed on
Sep 3, 2009
Sold by
Raudenbush Robert R and Raudenbush Esther C
Bought by
Raudenbush Robert R and Raudenbush Esther C
Home Financials for this Owner
Home Financials are based on the most recent Mortgage that was taken out on this home.
Original Mortgage
$127,900
Interest Rate
4.75%
Mortgage Type
New Conventional
Purchase Details
Closed on
Feb 26, 2004
Sold by
William Lyon Homes Inc
Bought by
Raudenbush Robert A and Raudenbush Esther C
Home Financials for this Owner
Home Financials are based on the most recent Mortgage that was taken out on this home.
Original Mortgage
$137,000
Interest Rate
4.37%
Mortgage Type
New Conventional
Create a Home Valuation Report for This Property
The Home Valuation Report is an in-depth analysis detailing your home's value as well as a comparison with similar homes in the area
Home Values in the Area
Average Home Value in this Area
Purchase History
| Date | Buyer | Sale Price | Title Company |
|---|---|---|---|
| Raudenbush Family Revocable Living Trust | -- | None Listed On Document | |
| Raudenbush Robert R | -- | Lsi North | |
| Raudenbush Robert A | $204,155 | Fidelity National Title |
Source: Public Records
Mortgage History
| Date | Status | Borrower | Loan Amount |
|---|---|---|---|
| Previous Owner | Raudenbush Robert R | $127,900 | |
| Previous Owner | Raudenbush Robert A | $137,000 |
Source: Public Records
Tax History Compared to Growth
Tax History
| Year | Tax Paid | Tax Assessment Tax Assessment Total Assessment is a certain percentage of the fair market value that is determined by local assessors to be the total taxable value of land and additions on the property. | Land | Improvement |
|---|---|---|---|---|
| 2025 | $831 | $119,196 | $35,700 | $83,496 |
| 2024 | $847 | $119,196 | $35,700 | $83,496 |
| 2023 | $847 | $110,391 | $31,850 | $78,541 |
| 2022 | $726 | $99,959 | $28,350 | $71,609 |
| 2021 | $759 | $92,702 | $24,500 | $68,202 |
| 2020 | $1,513 | $86,857 | $25,550 | $61,307 |
| 2019 | $1,469 | $81,706 | $22,050 | $59,656 |
| 2018 | $1,426 | $72,427 | $17,500 | $54,927 |
| 2017 | $2,192 | $65,342 | $16,800 | $48,542 |
| 2016 | $1,351 | $56,741 | $13,650 | $43,091 |
| 2015 | $1,348 | $47,476 | $9,450 | $38,026 |
| 2014 | $1,308 | $37,840 | $7,350 | $30,490 |
Source: Public Records
Map
Nearby Homes
- 1409 Palomino Farm Way
- 6242 Standing Elm St
- 1505 Dragonfly Ranch Ln
- 6216 Sterling Ranch Way
- 1023 Sunny Acres Ave
- 1504 Andrew David Ave
- 1008 Maple Pines Ave
- 6424 Amanda Michelle Ln
- 1213 Bistro Bay Ave Unit 3
- 6504 N Austin Moore St
- 1020 Oceanwood Ave
- 2014 Millergrove Ave
- 1008 Oceanwood Ave
- 6016 Star Point Ct
- 909 Nevada Blaze Ave
- 6020 Old Vines St
- 6446 Silver Estates St
- 6005 Golden Sun Ct
- 2255 Woodbluff Ave
- 5925 Teeter St
- 1417 Sagebrush Ranch Way
- 1409 Sagebrush Ranch Way
- 1505 Sagebrush Ranch Way
- 1505 Sagebrush Ranch Way Unit 3
- 1412 Lazy Hill Ranch Way
- 1408 Lazy Hill Ranch Way
- 1416 Lazy Hill Ranch Way
- 1504 Lazy Hill Ranch Way
- 1509 Sagebrush Ranch Way
- 1408 Sagebrush Ranch Way
- 1412 Sagebrush Ranch Way
- 1416 Sagebrush Ranch Way
- 6213 Black Mane Way
- 6227 Black Mane Way
- 6223 Black Mane Way
- 1508 Lazy Hill Ranch Way
- 6231 Black Mane Way
- 6219 Black Mane Way
- 1504 Sagebrush Ranch Way Unit 3
- 1513 Sagebrush Ranch Way