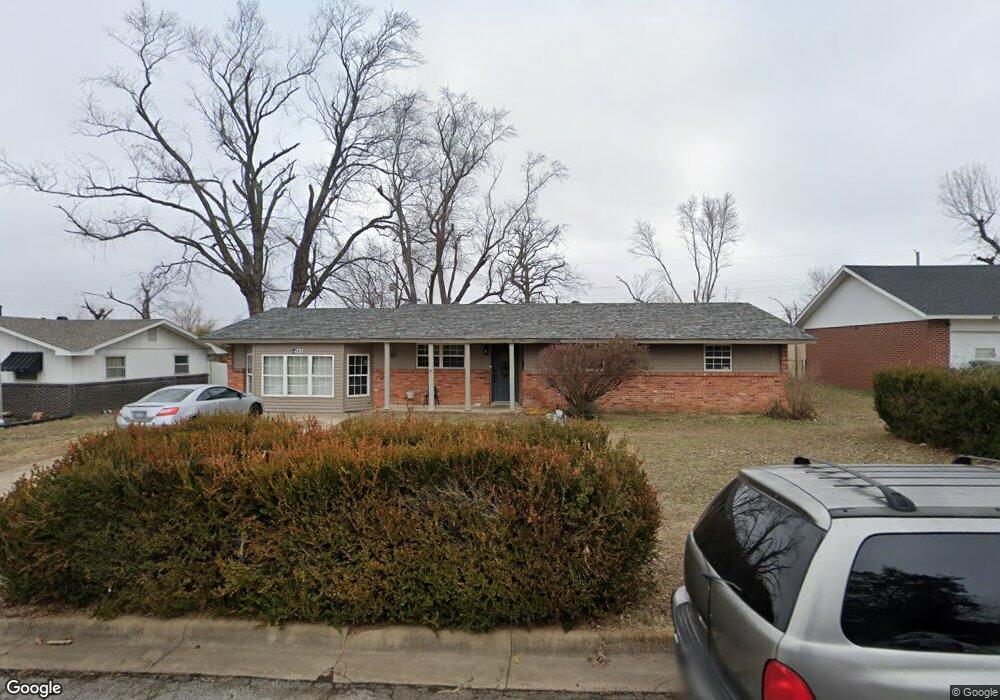
1413 W Sycamore St Rogers, AR 72758
Estimated Value: $291,000 - $359,000
3
Beds
2
Baths
1,315
Sq Ft
$248/Sq Ft
Est. Value
About This Home
This home is located at 1413 W Sycamore St, Rogers, AR 72758 and is currently estimated at $325,895, approximately $247 per square foot. 1413 W Sycamore St is a home located in Benton County with nearby schools including Frank Tillery Elementary School, Lingle Middle School, and Rogers Heritage High School.
Ownership History
Date
Name
Owned For
Owner Type
Purchase Details
Closed on
Jul 20, 2018
Sold by
Carranza Javier and Carranza Berta
Bought by
Carranza David
Current Estimated Value
Purchase Details
Closed on
Apr 21, 2005
Sold by
Guidry Joshua M
Bought by
Carranza Javier and Carranza Berta
Home Financials for this Owner
Home Financials are based on the most recent Mortgage that was taken out on this home.
Original Mortgage
$99,500
Outstanding Balance
$51,940
Interest Rate
6.06%
Mortgage Type
New Conventional
Estimated Equity
$273,955
Purchase Details
Closed on
Apr 23, 2001
Sold by
Guidry Jennifer L
Bought by
Guidry Joshua M
Purchase Details
Closed on
Apr 5, 2001
Bought by
Guidry
Purchase Details
Closed on
Jul 5, 2000
Bought by
Dod 07-05-2000
Purchase Details
Closed on
Aug 28, 1998
Bought by
Dod 08-28-1998
Purchase Details
Closed on
Dec 1, 1994
Bought by
Playford Fam Rev Trust
Create a Home Valuation Report for This Property
The Home Valuation Report is an in-depth analysis detailing your home's value as well as a comparison with similar homes in the area
Home Values in the Area
Average Home Value in this Area
Purchase History
| Date | Buyer | Sale Price | Title Company |
|---|---|---|---|
| Carranza David | -- | None Available | |
| Carranza Javier | $98,000 | Stewart Title Of Arkansas In | |
| Guidry Joshua M | -- | None Available | |
| Guidry | $76,000 | -- | |
| Dod 07-05-2000 | -- | -- | |
| Dod 08-28-1998 | -- | -- | |
| Playford Fam Rev Trust | -- | -- |
Source: Public Records
Mortgage History
| Date | Status | Borrower | Loan Amount |
|---|---|---|---|
| Open | Carranza Javier | $99,500 |
Source: Public Records
Tax History Compared to Growth
Tax History
| Year | Tax Paid | Tax Assessment Tax Assessment Total Assessment is a certain percentage of the fair market value that is determined by local assessors to be the total taxable value of land and additions on the property. | Land | Improvement |
|---|---|---|---|---|
| 2025 | $2,028 | $58,663 | $19,000 | $39,663 |
| 2024 | $1,814 | $58,663 | $19,000 | $39,663 |
| 2023 | $1,649 | $37,510 | $8,000 | $29,510 |
| 2022 | $1,582 | $37,510 | $8,000 | $29,510 |
| 2021 | $1,447 | $37,510 | $8,000 | $29,510 |
| 2020 | $1,316 | $23,970 | $2,400 | $21,570 |
| 2019 | $1,316 | $23,970 | $2,400 | $21,570 |
| 2018 | $1,316 | $23,970 | $2,400 | $21,570 |
| 2017 | $1,232 | $23,970 | $2,400 | $21,570 |
| 2016 | $704 | $23,970 | $2,400 | $21,570 |
| 2015 | $1,023 | $19,330 | $2,800 | $16,530 |
| 2014 | $673 | $19,330 | $2,800 | $16,530 |
Source: Public Records
Map
Nearby Homes
- 1406 W Pine St
- 1310 W Pecan St
- 910 S 16th St
- 917 S 15th St
- 902 S 17th St
- 600 S Scott Cir
- 930 S 14th St
- 501 S 12th St
- 1208 W Cherry St
- 1126 S 13th St
- 1603 W Poplar St
- 1202 S 13th St
- 1120 W Cypress St
- 1717 W Poplar St
- 1807 W Cypress St
- 2001 & 2003 W Sycamore St
- 1112 W Poplar St
- 1020 W Cypress St Unit 3
- 1312 S Countrywood Place
- 1311 Countrywood Place
- 1411 W Sycamore St
- 1415 W Sycamore St
- 1408 W Pine St
- 1410 W Pine St
- 1409 W Sycamore St
- 709 S 15th St
- 1414 W Sycamore St
- 1416 W Sycamore St
- 1412 W Sycamore St
- 707 S 15th St
- 1404 W Pine St
- 1407 W Sycamore St
- 1410 W Sycamore St
- 1418 W Sycamore St
- 1402 W Pine St
- 1408 W Sycamore St
- 1409 W Oak St
- 1403 W Sycamore St
- 1411 W Oak St
- 1401 & 1403 Sycamore St