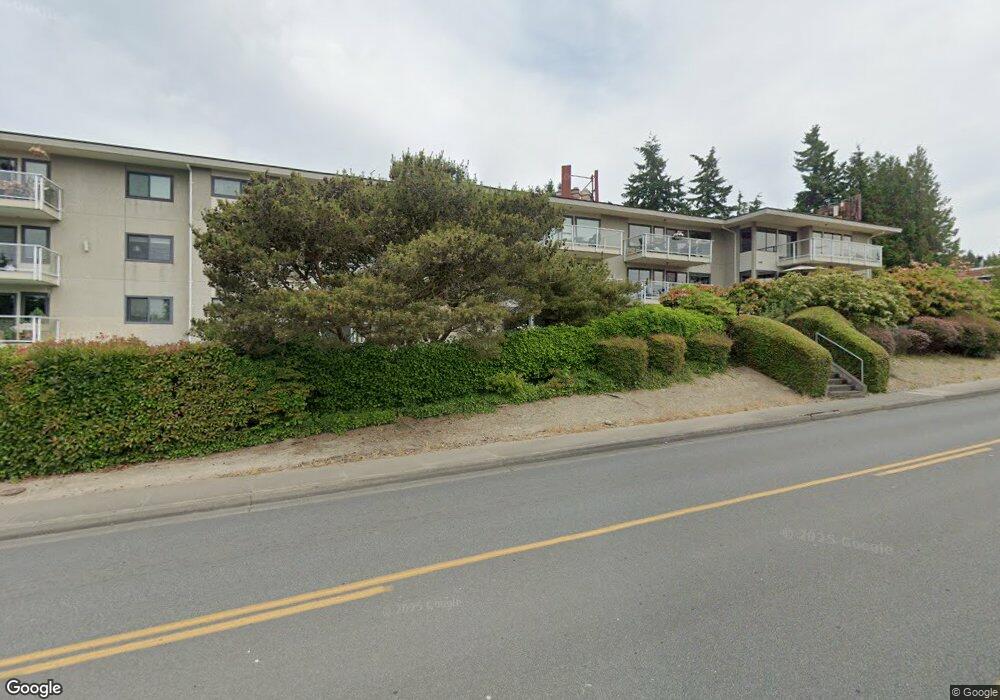
1414 9th Ave N Unit 303 Edmonds, WA 98020
Edmonds Bowl NeighborhoodEstimated Value: $595,199 - $709,000
2
Beds
2
Baths
1,119
Sq Ft
$584/Sq Ft
Est. Value
About This Home
This home is located at 1414 9th Ave N Unit 303, Edmonds, WA 98020 and is currently estimated at $653,300, approximately $583 per square foot. 1414 9th Ave N Unit 303 is a home located in Snohomish County with nearby schools including Edmonds Elementary School, Meadowdale Middle School, and Meadowdale High School.
Ownership History
Date
Name
Owned For
Owner Type
Purchase Details
Closed on
Jun 28, 2005
Sold by
Verbeek Dewey T and Verbeek Marilyn J
Bought by
L17-1 Central Monroe Llc
Current Estimated Value
Home Financials for this Owner
Home Financials are based on the most recent Mortgage that was taken out on this home.
Original Mortgage
$412,500
Outstanding Balance
$206,886
Interest Rate
5.65%
Mortgage Type
Purchase Money Mortgage
Estimated Equity
$446,414
Purchase Details
Closed on
Aug 11, 1997
Sold by
Willson Lois F
Bought by
Thompson Shirley P
Home Financials for this Owner
Home Financials are based on the most recent Mortgage that was taken out on this home.
Original Mortgage
$73,000
Interest Rate
7.61%
Create a Home Valuation Report for This Property
The Home Valuation Report is an in-depth analysis detailing your home's value as well as a comparison with similar homes in the area
Home Values in the Area
Average Home Value in this Area
Purchase History
| Date | Buyer | Sale Price | Title Company |
|---|---|---|---|
| L17-1 Central Monroe Llc | $550,000 | Chicago Title Insurance Co | |
| Thompson Shirley P | $129,900 | Fidelity National Title Co |
Source: Public Records
Mortgage History
| Date | Status | Borrower | Loan Amount |
|---|---|---|---|
| Open | L17-1 Central Monroe Llc | $412,500 | |
| Previous Owner | Thompson Shirley P | $73,000 |
Source: Public Records
Tax History
| Year | Tax Paid | Tax Assessment Tax Assessment Total Assessment is a certain percentage of the fair market value that is determined by local assessors to be the total taxable value of land and additions on the property. | Land | Improvement |
|---|---|---|---|---|
| 2026 | $236 | $644,800 | $220,000 | $424,800 |
| 2025 | $235 | $620,000 | $220,000 | $400,000 |
| 2024 | $235 | $538,300 | $220,000 | $318,300 |
| 2023 | $227 | $512,300 | $220,000 | $292,300 |
| 2022 | $272 | $445,500 | $200,000 | $245,500 |
| 2020 | $297 | $394,900 | $200,000 | $194,900 |
| 2019 | $496 | $359,600 | $200,000 | $159,600 |
| 2018 | $510 | $352,400 | $200,000 | $152,400 |
| 2017 | $347 | $283,000 | $165,500 | $117,500 |
| 2016 | $352 | $255,000 | $142,000 | $113,000 |
| 2015 | $605 | $231,500 | $132,000 | $99,500 |
| 2013 | $411 | $216,500 | $118,000 | $98,500 |
Source: Public Records
Map
Nearby Homes
- 1020 Puget Dr
- 19209 Olympic View Dr
- 928 Mountain Ln
- 747 Olympic Ave
- 192 XX Olympic View Dr
- 941 Glen St
- 216 Caspers St
- 1105 Daley Place
- 612 Aloha Way
- 609 7th Ave N Unit B304
- 8820 194th St SW
- 610 Glen St Unit 3
- 20319 92nd Ave W
- 8957 188th St SW
- 8608 196th St SW
- 645 Bell St Unit 102
- 19525 86th Ave W
- 300 2nd Ave N Unit 2E
- 8516 196th St SW Unit 105
- 8516 196th St SW Unit 302
- 1414 9th Ave N Unit 305
- 1414 9th Ave N Unit 304
- 1414 9th Ave N Unit 302
- 1414 9th Ave N Unit 301
- 1414 9th Ave N Unit 205
- 1414 9th Ave N Unit 204
- 1414 9th Ave N Unit 203
- 1414 9th Ave N Unit 202
- 1414 9th Ave N Unit 201
- 1414 9th Ave N Unit 104
- 1414 9th Ave N Unit 103
- 1414 9th Ave N Unit 102
- 1414 9th Ave N Unit 101
- 1414 9th Ave N
- 1418 9th Ave N
- 1402 9th Ave N
- 1420 9th Ave N
- 912 Puget Way
- 1422 9th Ave N
- 910 Puget Way
Your Personal Tour Guide
Ask me questions while you tour the home.