D
Seller's Agent in 2025
Dora Yen
Realty 8 Inc.
(847) 730-8800
6 in this area
19 Total Sales
Estimated Value: $198,252 - $277,000
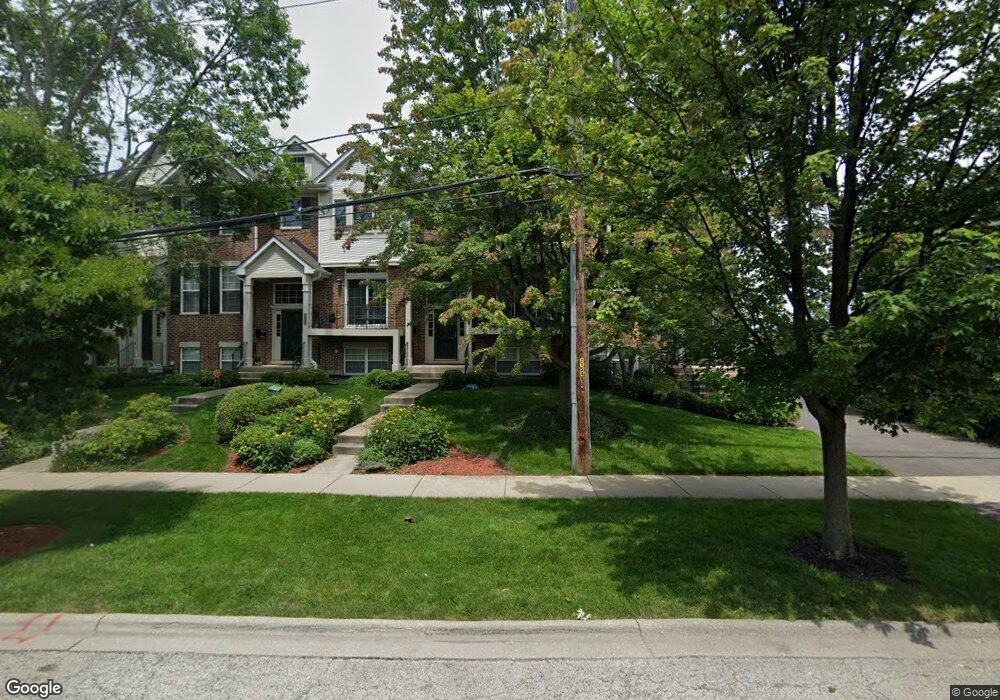
This home is located at 1414 Lehigh Ave Unit A1, Glenview, IL 60026 and is currently estimated at $240,313, approximately $200 per square foot. 1414 Lehigh Ave Unit A1 is a home located in Cook County with nearby schools including Lyon Elementary School, Pleasant Ridge Elementary School, and Attea Middle School.
| Date | Buyer | Sale Price | Title Company |
|---|---|---|---|
| Hsu Kuo | $92,500 | -- |
| Date | Status | Borrower | Loan Amount |
|---|---|---|---|
| Closed | Hsu Kuo | $43,000 |
| Date | Event | Price | List to Sale | Price per Sq Ft |
|---|---|---|---|---|
| 09/30/2025 09/30/25 | Rented | $1,650 | 0.0% | -- |
| 08/04/2025 08/04/25 | For Rent | $1,650 | 0.0% | -- |
| 06/03/2025 06/03/25 | Off Market | $1,650 | -- | -- |
| 05/13/2025 05/13/25 | For Rent | $1,650 | 0.0% | -- |
| 05/10/2025 05/10/25 | Off Market | $1,650 | -- | -- |
| 05/07/2025 05/07/25 | For Rent | $1,650 | +13.8% | -- |
| 08/17/2022 08/17/22 | Rented | $1,450 | 0.0% | -- |
| 08/11/2022 08/11/22 | For Rent | $1,450 | 0.0% | -- |
| 08/10/2021 08/10/21 | Rented | -- | -- | -- |
| 07/20/2021 07/20/21 | For Rent | $1,450 | -3.3% | -- |
| 09/06/2019 09/06/19 | Rented | $1,500 | 0.0% | -- |
| 08/23/2019 08/23/19 | For Rent | $1,500 | -- | -- |
| Year | Tax Paid | Tax Assessment Tax Assessment Total Assessment is a certain percentage of the fair market value that is determined by local assessors to be the total taxable value of land and additions on the property. | Land | Improvement |
|---|---|---|---|---|
| 2024 | $3,402 | $15,371 | $3,506 | $11,865 |
| 2023 | $3,306 | $15,371 | $3,506 | $11,865 |
| 2022 | $3,306 | $15,371 | $3,506 | $11,865 |
| 2021 | $2,707 | $10,875 | $2,880 | $7,995 |
| 2020 | $2,675 | $10,875 | $2,880 | $7,995 |
| 2019 | $2,504 | $12,003 | $2,880 | $9,123 |
| 2018 | $2,536 | $11,027 | $1,502 | $9,525 |
| 2017 | $2,469 | $11,027 | $1,502 | $9,525 |
| 2016 | $2,310 | $10,920 | $1,502 | $9,418 |
| 2015 | $1,949 | $10,806 | $2,003 | $8,803 |
| 2014 | $1,926 | $10,806 | $2,003 | $8,803 |
| 2013 | $1,853 | $10,806 | $2,003 | $8,803 |
D
Seller's Agent in 2025
Dora Yen
Realty 8 Inc.
(847) 730-8800
6 in this area
19 Total Sales
R
Seller Co-Listing Agent in 2025
Richard Yen
Realty 8 Inc.
(847) 707-0858
4 in this area
13 Total Sales

Buyer's Agent in 2025
Than Zual
Real People Realty
(701) 261-1890
56 Total Sales
J
Buyer's Agent in 2022
Jennifer Ambrose
Keller Williams Success Realty
(847) 722-8697
63 Total Sales
I
Buyer's Agent in 2021
Inhye Rhee
JStar Investment, INC
(224) 595-1761
31 Total Sales
Seller's Agent in 2019
Shawn McGuiness Gavin
Baird Warner
(847) 651-8074
22 Total Sales