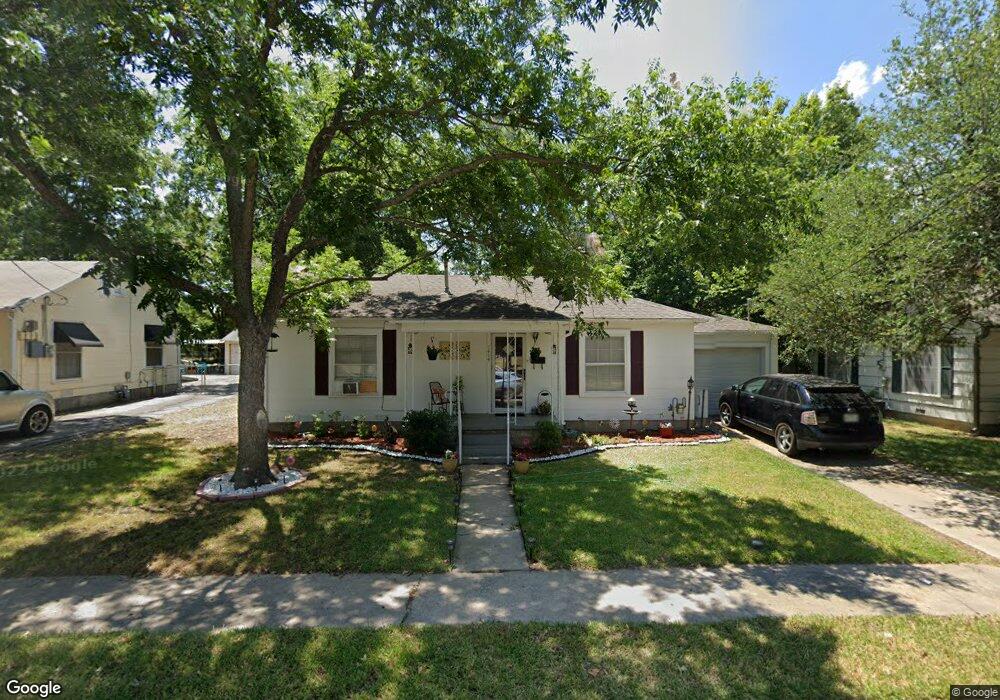
1414 Myrtle St Gainesville, TX 76240
Estimated Value: $160,587 - $215,000
3
Beds
1
Bath
931
Sq Ft
$197/Sq Ft
Est. Value
About This Home
This home is located at 1414 Myrtle St, Gainesville, TX 76240 and is currently estimated at $183,647, approximately $197 per square foot. 1414 Myrtle St is a home located in Cooke County with nearby schools including Edison Elementary School, W.E. Chalmers Elementary School, and Gainesville Intermediate School.
Ownership History
Date
Name
Owned For
Owner Type
Purchase Details
Closed on
May 5, 2020
Sold by
Thomason George and Thomason Alice
Bought by
Rodriguez Hector
Current Estimated Value
Home Financials for this Owner
Home Financials are based on the most recent Mortgage that was taken out on this home.
Original Mortgage
$93,000
Outstanding Balance
$82,365
Interest Rate
3.5%
Mortgage Type
Seller Take Back
Estimated Equity
$101,282
Purchase Details
Closed on
Jan 8, 2020
Sold by
West Vincent A
Bought by
Thomason George and Thomason Alice
Purchase Details
Closed on
Feb 13, 2013
Sold by
Hunter Whitney D and Rich Whitney D
Bought by
West Vincent A
Purchase Details
Closed on
Sep 10, 2008
Sold by
Prestage Joanne
Bought by
Hunter Whitney D
Home Financials for this Owner
Home Financials are based on the most recent Mortgage that was taken out on this home.
Original Mortgage
$61,734
Interest Rate
6.54%
Mortgage Type
New Conventional
Create a Home Valuation Report for This Property
The Home Valuation Report is an in-depth analysis detailing your home's value as well as a comparison with similar homes in the area
Home Values in the Area
Average Home Value in this Area
Purchase History
| Date | Buyer | Sale Price | Title Company |
|---|---|---|---|
| Rodriguez Hector | -- | None Available | |
| Thomason George | -- | None Available | |
| West Vincent A | -- | None Available | |
| Hunter Whitney D | -- | -- |
Source: Public Records
Mortgage History
| Date | Status | Borrower | Loan Amount |
|---|---|---|---|
| Open | Rodriguez Hector | $93,000 | |
| Previous Owner | Hunter Whitney D | $61,734 |
Source: Public Records
Tax History Compared to Growth
Tax History
| Year | Tax Paid | Tax Assessment Tax Assessment Total Assessment is a certain percentage of the fair market value that is determined by local assessors to be the total taxable value of land and additions on the property. | Land | Improvement |
|---|---|---|---|---|
| 2025 | $2,656 | $140,157 | $43,869 | $96,288 |
| 2024 | $2,656 | $140,140 | $43,852 | $96,288 |
| 2023 | $2,706 | $137,940 | $39,865 | $98,075 |
| 2022 | $2,574 | $118,255 | $35,537 | $82,718 |
| 2021 | $2,245 | $87,175 | $23,691 | $63,484 |
| 2020 | $1,377 | $77,932 | $22,552 | $55,380 |
| 2019 | $1,289 | $57,336 | $22,552 | $34,784 |
| 2018 | $1,170 | $42,865 | $11,276 | $31,589 |
| 2017 | $1,126 | $41,402 | $11,276 | $30,126 |
| 2015 | $1,086 | $40,819 | $11,276 | $29,543 |
| 2014 | $1,086 | $40,819 | $11,276 | $29,543 |
Source: Public Records
Map
Nearby Homes
- 1016 N Howeth St
- 1520 Olive St
- 811 Ritchey St
- 805 Ritchey St
- 802 Myrtle St
- 1102 Fair Ave
- 705 Fair Ave
- 1113 Fair Ave
- 901 N Morris St
- 608 Ritchey St
- 1305 Hillcrest Blvd
- 1306 N Clements St
- TBD County Road 208
- 764
- 1109 Elmwood St
- Lot #2 Belcher St
- Lot #1 Belcher St
- Lot #3 Belcher St
- 00 O'Neal St
- 1907 Woodlawn Ct
- 1420 Myrtle St
- 1412 Myrtle St
- 1424 Myrtle St
- 1423 Olive St
- 1410 Myrtle St
- 907 N Howeth St
- 1425 Olive St
- 909 N Howeth St
- 1413 Myrtle St
- 1427 Olive St
- 1415 Myrtle St
- 1408 Myrtle St
- 1413 Olive St
- 1001 N Howeth St
- 1411 Myrtle St
- 903 N Howeth St
- 1425 Myrtle St
- 905 N Howeth St
- 1411 Olive St
- 1406 Myrtle St