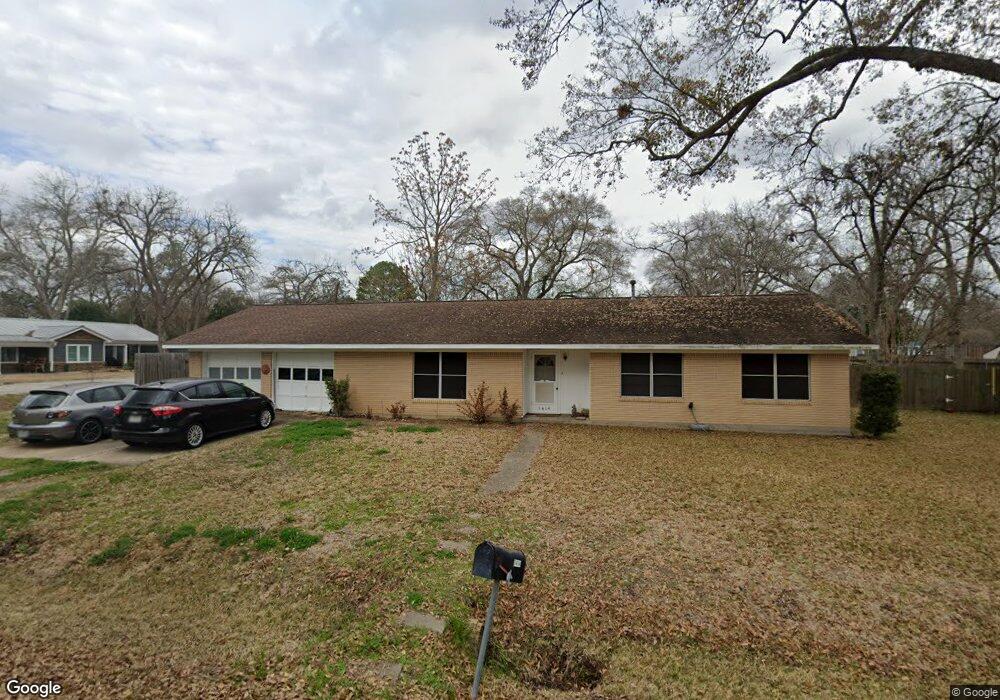
1414 Travis St Richmond, TX 77469
Estimated Value: $187,437 - $239,000
3
Beds
2
Baths
1,407
Sq Ft
$150/Sq Ft
Est. Value
About This Home
This home is located at 1414 Travis St, Richmond, TX 77469 and is currently estimated at $210,359, approximately $149 per square foot. 1414 Travis St is a home located in Fort Bend County with nearby schools including Jane Long Elementary School, J J Wessendorff Middle School, and Lamar Junior High School.
Ownership History
Date
Name
Owned For
Owner Type
Purchase Details
Closed on
Jan 31, 2003
Sold by
Oakley Diane and Allen Diane Oakley
Bought by
Stavinoha James
Current Estimated Value
Home Financials for this Owner
Home Financials are based on the most recent Mortgage that was taken out on this home.
Original Mortgage
$63,200
Interest Rate
5.9%
Purchase Details
Closed on
Feb 6, 1997
Sold by
Oakley Terry A
Bought by
Oakley Diane
Home Financials for this Owner
Home Financials are based on the most recent Mortgage that was taken out on this home.
Original Mortgage
$61,750
Interest Rate
7.64%
Mortgage Type
Seller Take Back
Purchase Details
Closed on
Nov 23, 1994
Sold by
Martin John Dee and Teresa Lynne
Bought by
Stavinoha James
Create a Home Valuation Report for This Property
The Home Valuation Report is an in-depth analysis detailing your home's value as well as a comparison with similar homes in the area
Home Values in the Area
Average Home Value in this Area
Purchase History
| Date | Buyer | Sale Price | Title Company |
|---|---|---|---|
| Stavinoha James | -- | American Title Co | |
| Oakley Diane | -- | -- | |
| Stavinoha James | -- | -- |
Source: Public Records
Mortgage History
| Date | Status | Borrower | Loan Amount |
|---|---|---|---|
| Previous Owner | Stavinoha James | $63,200 | |
| Previous Owner | Oakley Diane | $61,750 |
Source: Public Records
Tax History Compared to Growth
Tax History
| Year | Tax Paid | Tax Assessment Tax Assessment Total Assessment is a certain percentage of the fair market value that is determined by local assessors to be the total taxable value of land and additions on the property. | Land | Improvement |
|---|---|---|---|---|
| 2025 | $1,367 | $109,546 | $23,540 | $86,006 |
| 2024 | $1,367 | $119,838 | $919 | $118,919 |
| 2023 | $1,161 | $108,944 | $0 | $119,942 |
| 2022 | $1,711 | $99,040 | $0 | $110,860 |
| 2021 | $2,138 | $90,040 | $23,540 | $66,500 |
| 2020 | $2,177 | $90,330 | $23,540 | $66,790 |
| 2019 | $2,271 | $88,940 | $23,540 | $65,400 |
| 2018 | $2,181 | $84,880 | $23,540 | $61,340 |
| 2017 | $2,167 | $83,370 | $23,540 | $59,830 |
| 2016 | $2,169 | $83,460 | $23,540 | $59,920 |
| 2015 | $1,779 | $83,910 | $23,540 | $60,370 |
| 2014 | $1,905 | $82,690 | $23,540 | $59,150 |
Source: Public Records
Map
Nearby Homes
- 512 and 514 Travis St
- 6219 Deep Gulch Dr
- 6215 Deep Gulch Dr
- 6218 Deep Gulch Dr
- 606 Fannin St
- 800 Jackson St
- 1205 Preston St
- 505 Austin St
- 0 Preston St
- 107 N 10th St
- 205 Clark St
- 206 Clark St
- 1109 Frances Dr
- 702 Morton St
- 1004 Country Club Dr
- 603 Calhoun St
- 303 Austin St
- 221 Rochelle St
- 400 Hillcrest Dr
- 7315 Audubon Russet Dr
- 1404 Travis St
- 1402 Travis St
- 803 Newell Dr
- 1407 Austin St
- 806 Newell Dr
- 901 Victoria Dr
- 1311 Austin St
- 1503 Austin St
- 1510 Travis St
- 900 Victoria Dr
- 905 Victoria Dr
- 1311 Travis St
- 716 S Union St
- 1517 Austin St
- 1401 Travis St
- 904 Victoria Dr
- 1514 Travis St
- 1530 Austin St
- 706 S Union St
- 1305 Travis St