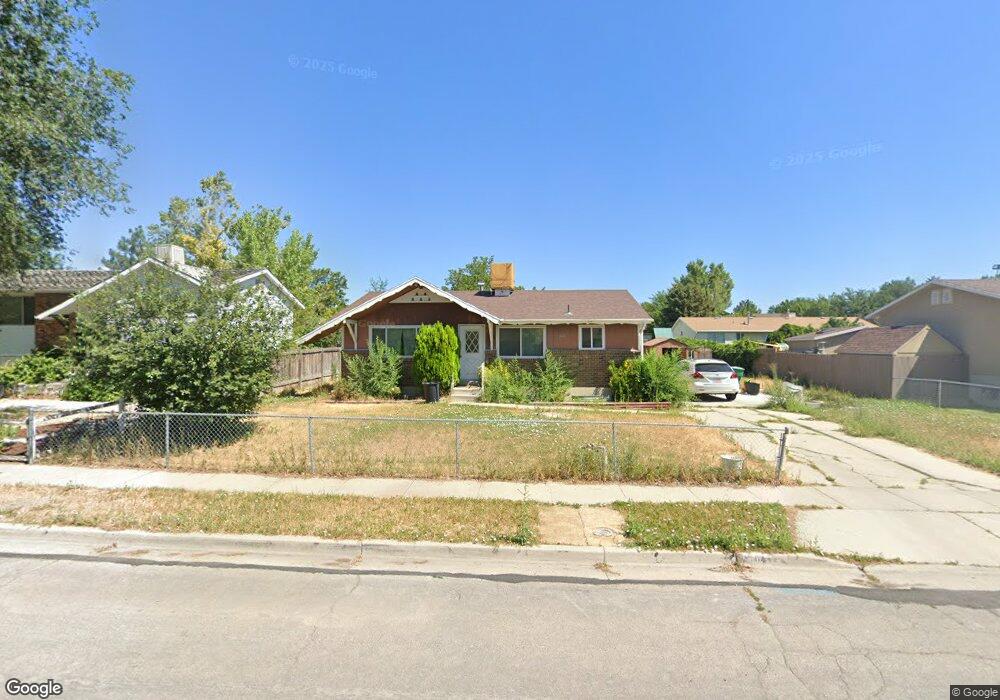
1414 W 6915 S West Jordan, UT 84084
Estimated Value: $449,023 - $513,000
3
Beds
2
Baths
1,944
Sq Ft
$241/Sq Ft
Est. Value
About This Home
This home is located at 1414 W 6915 S, West Jordan, UT 84084 and is currently estimated at $469,006, approximately $241 per square foot. 1414 W 6915 S is a home located in Salt Lake County with nearby schools including Heartland Elementary School, West Jordan Middle School, and West Jordan High School.
Ownership History
Date
Name
Owned For
Owner Type
Purchase Details
Closed on
Nov 12, 2020
Sold by
Bone Richard Garner and Bone Carla Riddle
Bought by
Weatherford Naomi and Weatherford Jarom
Current Estimated Value
Home Financials for this Owner
Home Financials are based on the most recent Mortgage that was taken out on this home.
Original Mortgage
$300,700
Outstanding Balance
$267,580
Interest Rate
2.8%
Mortgage Type
New Conventional
Estimated Equity
$201,426
Purchase Details
Closed on
Aug 14, 1995
Sold by
Bone Richard Garner
Bought by
Bone Richard Garner and Bone Carla Riddle
Home Financials for this Owner
Home Financials are based on the most recent Mortgage that was taken out on this home.
Original Mortgage
$53,800
Interest Rate
7.71%
Create a Home Valuation Report for This Property
The Home Valuation Report is an in-depth analysis detailing your home's value as well as a comparison with similar homes in the area
Home Values in the Area
Average Home Value in this Area
Purchase History
| Date | Buyer | Sale Price | Title Company |
|---|---|---|---|
| Weatherford Naomi | -- | Old Republic Ttl Draper Orem | |
| Bone Richard Garner | -- | -- |
Source: Public Records
Mortgage History
| Date | Status | Borrower | Loan Amount |
|---|---|---|---|
| Open | Weatherford Naomi | $300,700 | |
| Previous Owner | Bone Richard Garner | $53,800 |
Source: Public Records
Tax History Compared to Growth
Tax History
| Year | Tax Paid | Tax Assessment Tax Assessment Total Assessment is a certain percentage of the fair market value that is determined by local assessors to be the total taxable value of land and additions on the property. | Land | Improvement |
|---|---|---|---|---|
| 2025 | $1,928 | $404,600 | $137,400 | $267,200 |
| 2024 | $1,928 | $371,000 | $126,500 | $244,500 |
| 2023 | $1,923 | $348,700 | $121,600 | $227,100 |
| 2022 | $2,006 | $357,800 | $119,300 | $238,500 |
| 2021 | $1,713 | $278,200 | $91,600 | $186,600 |
| 2020 | $1,528 | $232,900 | $79,200 | $153,700 |
| 2019 | $1,455 | $217,500 | $79,200 | $138,300 |
| 2018 | $1,320 | $195,600 | $75,700 | $119,900 |
| 2017 | $1,224 | $180,700 | $75,700 | $105,000 |
| 2016 | $1,191 | $165,200 | $75,700 | $89,500 |
| 2015 | $1,194 | $161,400 | $80,800 | $80,600 |
| 2014 | $1,070 | $142,400 | $72,100 | $70,300 |
Source: Public Records
Map
Nearby Homes
- 6773 S 1300 W
- 6937 S Hollow View Way
- 6618 1420 W
- 6660 S Ryker Vista Ln
- 6687 Bonham Ln
- 7118 S Equator Ln Unit 14 B
- 7108 S 1205 W
- 7087 S 1205 W
- 7165 Callie Dr
- 7194 S 1380 W
- 1451 S Bluemont Dr
- 1501 W Bluemont Dr
- 6987 Overview Way
- 1607 W Beamon St
- 1384 W 7290 S
- 1235 W Athleen Dr
- 6440 S 1190 W Unit 200
- 1146 Athleen Dr
- 6486 S 1140 W Unit 182
- 6925 S Lexington Dr