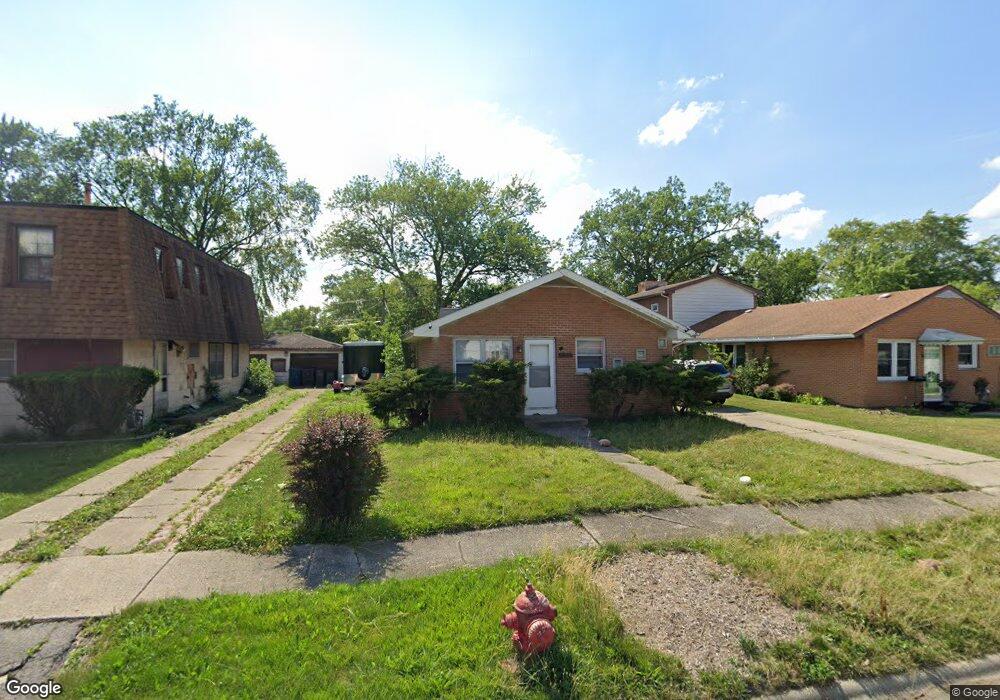
14140 Marshfield Ave Dixmoor, IL 60426
Estimated Value: $111,000 - $179,000
4
Beds
2
Baths
1,212
Sq Ft
$117/Sq Ft
Est. Value
About This Home
This home is located at 14140 Marshfield Ave, Dixmoor, IL 60426 and is currently estimated at $141,988, approximately $117 per square foot. 14140 Marshfield Ave is a home located in Cook County with nearby schools including Thornton Township High School.
Ownership History
Date
Name
Owned For
Owner Type
Purchase Details
Closed on
Jul 22, 2014
Sold by
Nugent Jack
Bought by
First Midwest Bank and Trust #7550
Current Estimated Value
Purchase Details
Closed on
Apr 6, 2009
Sold by
Us Bank National Association
Bought by
Nugent Jack
Purchase Details
Closed on
Jan 28, 2009
Sold by
Williams Jerry Q
Bought by
Us Bank National Association
Purchase Details
Closed on
Aug 22, 2005
Sold by
Smith Stephen H
Bought by
Williams Jerry Q and Williams Katheryn
Home Financials for this Owner
Home Financials are based on the most recent Mortgage that was taken out on this home.
Original Mortgage
$61,600
Interest Rate
5.93%
Mortgage Type
Fannie Mae Freddie Mac
Purchase Details
Closed on
Aug 18, 2003
Sold by
Smith Stephen H and Smith Denise L
Bought by
Smith Stephen H
Purchase Details
Closed on
Aug 1, 2003
Sold by
Smith Stephen H
Bought by
Smith Stephen H and Smith Denise
Create a Home Valuation Report for This Property
The Home Valuation Report is an in-depth analysis detailing your home's value as well as a comparison with similar homes in the area
Home Values in the Area
Average Home Value in this Area
Purchase History
| Date | Buyer | Sale Price | Title Company |
|---|---|---|---|
| First Midwest Bank | -- | None Available | |
| Nugent Jack | $20,000 | Attorneys Title Guaranty Fun | |
| Us Bank National Association | -- | None Available | |
| Williams Jerry Q | $77,000 | First American Title | |
| Smith Stephen H | -- | -- | |
| Smith Stephen H | -- | -- |
Source: Public Records
Mortgage History
| Date | Status | Borrower | Loan Amount |
|---|---|---|---|
| Previous Owner | Williams Jerry Q | $61,600 |
Source: Public Records
Tax History Compared to Growth
Tax History
| Year | Tax Paid | Tax Assessment Tax Assessment Total Assessment is a certain percentage of the fair market value that is determined by local assessors to be the total taxable value of land and additions on the property. | Land | Improvement |
|---|---|---|---|---|
| 2024 | $2,856 | $6,301 | $1,563 | $4,738 |
| 2023 | $2,053 | $6,301 | $1,563 | $4,738 |
| 2022 | $2,053 | $3,745 | $1,563 | $2,182 |
| 2021 | $1,995 | $3,743 | $1,562 | $2,181 |
| 2020 | $2,219 | $4,341 | $1,562 | $2,779 |
| 2019 | $2,629 | $4,981 | $1,406 | $3,575 |
| 2018 | $2,577 | $4,981 | $1,406 | $3,575 |
| 2017 | $2,887 | $5,627 | $1,406 | $4,221 |
| 2016 | $2,570 | $5,153 | $1,250 | $3,903 |
| 2015 | $2,793 | $5,729 | $1,250 | $4,479 |
| 2014 | $2,733 | $5,729 | $1,250 | $4,479 |
| 2013 | $2,869 | $6,508 | $1,250 | $5,258 |
Source: Public Records
Map
Nearby Homes
- 14245 Lincoln Ave
- 14533 Myrtle Ave
- 14543 Myrtle Ave
- 14600 Loomis Ave
- 14523 Lexington Ave
- 14564 Spaulding Ave
- 14502 Kentucky Ave
- 14519 Harvey Ave
- 14735 Myrtle Ave
- 14727 Wood St
- 14542 Sangamon St
- 238 Calumet Blvd
- 14807 Paulina St
- 14514 Cooper Ave
- 14452 Green St
- 14622 Vincennes Rd
- 14301 S Halsted St
- 14637 Center Ave
- 14806 Lincoln Ave
- 14725 Turlington Ave
- 14140 Marshfield Ave
- 14140 Marshfield Ave
- 14200 Marshfield Ave
- 14136 Marshfield Ave
- 14132 Marshfield Ave
- 14204 Marshfield Ave
- 14131 Circle Dr
- 14135 Circle Dr
- 14127 Circle Dr
- 14128 Marshfield Ave
- 14139 Circle Dr
- 14135 Marshfield Ave
- 14139 Marshfield Ave
- 14131 Marshfield Ave
- 14124 Marshfield Ave
- 14123 Circle Dr
- 14201 Circle Dr
- 14201 Marshfield Ave
- 14127 Marshfield Ave
- 14205 Marshfield Ave