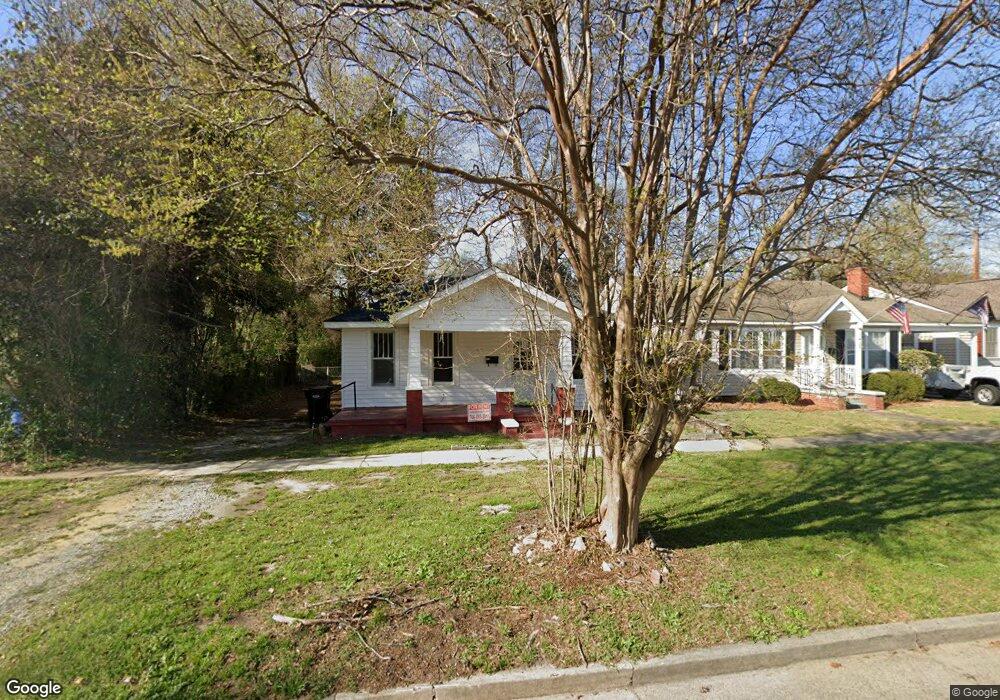
1415 21st St Columbus, GA 31901
East Highlands NeighborhoodEstimated Value: $88,247 - $122,000
2
Beds
2
Baths
1,036
Sq Ft
$103/Sq Ft
Est. Value
About This Home
This home is located at 1415 21st St, Columbus, GA 31901 and is currently estimated at $106,312, approximately $102 per square foot. 1415 21st St is a home located in Muscogee County with nearby schools including Arnold Middle School, Jordan Vocational High School, and Wynnton Elementary School.
Ownership History
Date
Name
Owned For
Owner Type
Purchase Details
Closed on
Dec 21, 2021
Sold by
Cf Properties Llc
Bought by
Columbus 26 Partners Llc
Current Estimated Value
Purchase Details
Closed on
Feb 5, 2021
Sold by
Lr Properties Llc
Bought by
Cf Properties Llc
Purchase Details
Closed on
Jan 29, 2016
Sold by
Federal National Mortgage Association
Bought by
Lr Partners Llc
Purchase Details
Closed on
Nov 3, 2015
Sold by
Clegg Rw
Bought by
Federal National Mtg Associati
Purchase Details
Closed on
Mar 29, 2013
Sold by
Clegg R W
Bought by
Clegg R W and Noblin Kim
Create a Home Valuation Report for This Property
The Home Valuation Report is an in-depth analysis detailing your home's value as well as a comparison with similar homes in the area
Home Values in the Area
Average Home Value in this Area
Purchase History
| Date | Buyer | Sale Price | Title Company |
|---|---|---|---|
| Columbus 26 Partners Llc | $5,349,254 | -- | |
| Cf Properties Llc | $761,000 | -- | |
| Lr Partners Llc | $16,500 | -- | |
| Federal National Mtg Associati | -- | -- | |
| Clegg R W | -- | -- |
Source: Public Records
Tax History Compared to Growth
Tax History
| Year | Tax Paid | Tax Assessment Tax Assessment Total Assessment is a certain percentage of the fair market value that is determined by local assessors to be the total taxable value of land and additions on the property. | Land | Improvement |
|---|---|---|---|---|
| 2025 | $3,064 | $22,188 | $5,820 | $16,368 |
| 2024 | $1,912 | $22,188 | $5,820 | $16,368 |
| 2023 | $874 | $22,188 | $5,820 | $16,368 |
| 2022 | $623 | $15,260 | $5,820 | $9,440 |
| 2021 | $408 | $10,000 | $2,500 | $7,500 |
| 2020 | $408 | $10,000 | $2,500 | $7,500 |
| 2019 | $410 | $10,000 | $2,500 | $7,500 |
| 2018 | $270 | $18,964 | $7,756 | $11,208 |
| 2017 | $271 | $6,600 | $2,720 | $3,880 |
| 2016 | $573 | $6,600 | $2,600 | $4,000 |
| 2015 | $563 | $13,635 | $2,600 | $11,035 |
| 2014 | $564 | $13,635 | $2,600 | $11,035 |
| 2013 | -- | $13,635 | $2,600 | $11,035 |
Source: Public Records
Map
Nearby Homes