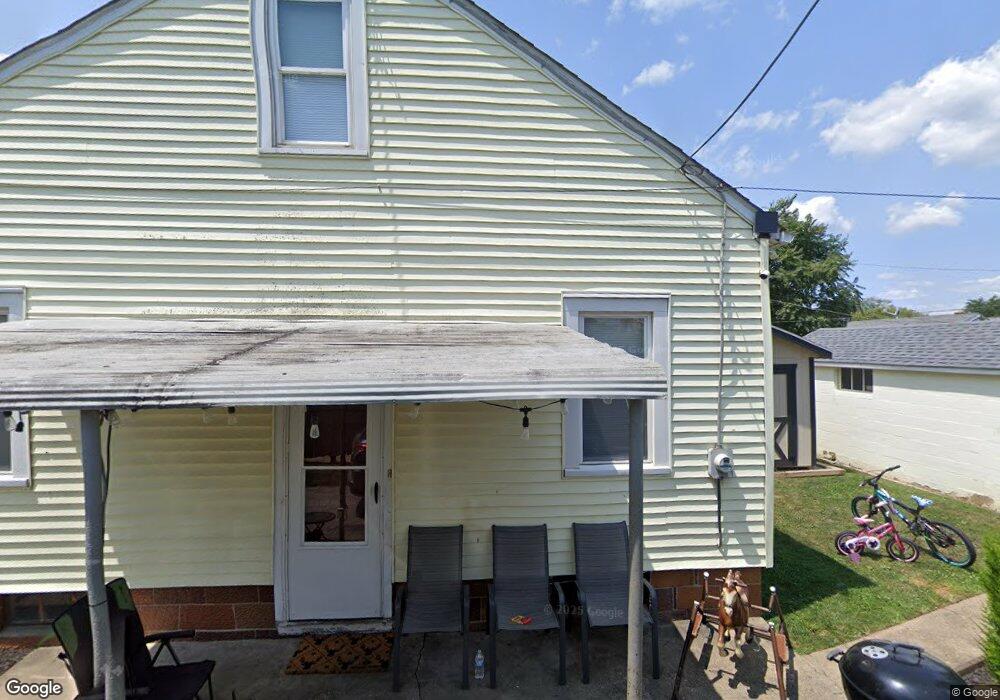
1415 8th Ave Lancaster, OH 43130
Estimated Value: $129,000 - $193,000
2
Beds
2
Baths
1,131
Sq Ft
$147/Sq Ft
Est. Value
About This Home
This home is located at 1415 8th Ave, Lancaster, OH 43130 and is currently estimated at $166,396, approximately $147 per square foot. 1415 8th Ave is a home located in Fairfield County with nearby schools including General Sherman Junior High School, Lancaster High School, and St Mary Elementary School.
Ownership History
Date
Name
Owned For
Owner Type
Purchase Details
Closed on
Jan 17, 2013
Sold by
Belmont Joe and Belmont Joe
Bought by
Crb Rentals Llc
Current Estimated Value
Purchase Details
Closed on
Sep 23, 2008
Sold by
Wells Fargo Bank Na
Bought by
Belmont Joe
Purchase Details
Closed on
Jan 18, 2008
Sold by
Gordon Sharon
Bought by
Wells Fargo Bank Na
Purchase Details
Closed on
Dec 14, 2005
Sold by
Reed Dennis E and Reed Patricia A
Bought by
Gordon Sharon
Home Financials for this Owner
Home Financials are based on the most recent Mortgage that was taken out on this home.
Original Mortgage
$69,200
Interest Rate
8.65%
Mortgage Type
Purchase Money Mortgage
Purchase Details
Closed on
Dec 13, 2004
Sold by
Riggs Thelma L
Bought by
Reed Dennis E and Reed Patricia A
Create a Home Valuation Report for This Property
The Home Valuation Report is an in-depth analysis detailing your home's value as well as a comparison with similar homes in the area
Home Values in the Area
Average Home Value in this Area
Purchase History
| Date | Buyer | Sale Price | Title Company |
|---|---|---|---|
| Crb Rentals Llc | -- | None Available | |
| Belmont Joe | $57,500 | None Available | |
| Wells Fargo Bank Na | $50,000 | None Available | |
| Gordon Sharon | $86,500 | Lawyers Title Agency Of Lanc | |
| Reed Dennis E | $64,000 | Lawyers Title Agency Of Lanc |
Source: Public Records
Mortgage History
| Date | Status | Borrower | Loan Amount |
|---|---|---|---|
| Previous Owner | Gordon Sharon | $69,200 | |
| Previous Owner | Gordon Sharon | $17,300 |
Source: Public Records
Tax History
| Year | Tax Paid | Tax Assessment Tax Assessment Total Assessment is a certain percentage of the fair market value that is determined by local assessors to be the total taxable value of land and additions on the property. | Land | Improvement |
|---|---|---|---|---|
| 2025 | $2,896 | $48,690 | $7,840 | $40,850 |
| 2024 | $2,896 | $32,210 | $4,870 | $27,340 |
| 2023 | $1,222 | $32,210 | $4,870 | $27,340 |
| 2022 | $1,226 | $32,210 | $4,870 | $27,340 |
| 2021 | $977 | $23,950 | $4,870 | $19,080 |
| 2020 | $983 | $23,950 | $4,870 | $19,080 |
| 2019 | $894 | $23,950 | $4,870 | $19,080 |
| 2018 | $781 | $19,460 | $4,870 | $14,590 |
| 2017 | $782 | $20,180 | $4,870 | $15,310 |
| 2016 | $762 | $20,180 | $4,870 | $15,310 |
| 2015 | $781 | $20,270 | $4,870 | $15,400 |
| 2014 | $745 | $20,270 | $4,870 | $15,400 |
| 2013 | $745 | $20,270 | $4,870 | $15,400 |
Source: Public Records
Map
Nearby Homes
- 1616 W Fair Ave
- 539 N Ohio Ave
- 1829 Beacon St
- 1125 Zimmer St
- 701 Washington Ave
- 844 Washington Ave
- 461 N Shoshone Dr
- 507 Washington Ave
- 215 Summitview Dr
- 1829 Shoshone Dr
- 1000 Goodwin Ave
- 302 Washington Ave
- 1511 Cedar Hill Rd
- 132 N Pierce Ave
- 1414 Cedar Hill Rd
- 757 W Mulberry St
- 114-116 S Cedar Ave
- 202 Wildwood Ave
- 32 2nd St
- 82 W 5th St
- 1421 8th Ave
- 1411 8th Ave
- 810 Grant Ave
- 1425 8th Ave
- 1407 8th Ave
- 814 Grant Ave
- 1418 8th Ave
- 813 Jefferson Ave
- 1424 8th Ave
- 1401 8th Ave
- 818 Grant Ave
- 1400 8th Ave
- 819 Jefferson Ave
- 822 Grant Ave
- 0 Jefferson Ave Unit 9919870
- 0 Jefferson Ave Unit 224009447
- 0 Jefferson Ave Unit 222039028
- 0 Jefferson Ave Unit 220021418
- 0 Jefferson Ave Unit 220009365
- 0 Jefferson Ave Unit 9923046
Your Personal Tour Guide
Ask me questions while you tour the home.