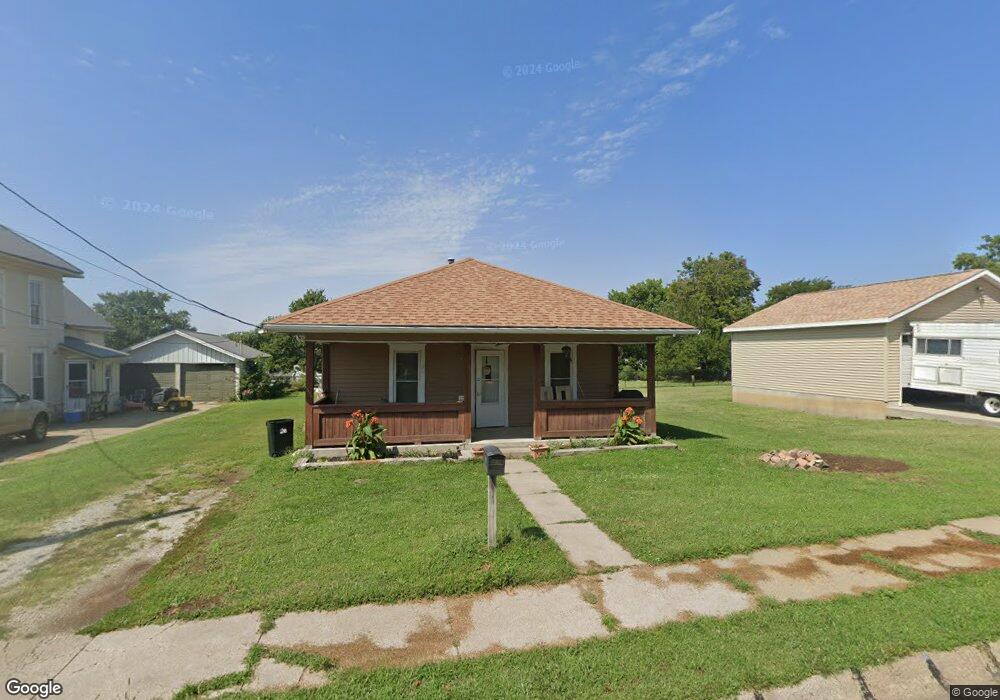
1415 Barada St Falls City, NE 68355
Estimated Value: $53,000 - $63,028
2
Beds
1
Bath
884
Sq Ft
$67/Sq Ft
Est. Value
About This Home
This home is located at 1415 Barada St, Falls City, NE 68355 and is currently estimated at $59,257, approximately $67 per square foot. 1415 Barada St is a home located in Richardson County with nearby schools including Falls City North Elementary School, Falls City South Elementary School, and Falls City Middle School.
Ownership History
Date
Name
Owned For
Owner Type
Purchase Details
Closed on
Jan 27, 2020
Sold by
Eugene Spinner Steven
Bought by
M & L Dougherty Enterprises Llc
Current Estimated Value
Purchase Details
Closed on
Feb 9, 2011
Sold by
Messler Catherine A
Bought by
Spinner Steven Eugene
Purchase Details
Closed on
Apr 25, 2001
Sold by
Pratt Alvin L and Pratt Barbara S
Bought by
Messler Trust Neeld J & Catherine
Purchase Details
Closed on
Apr 18, 2001
Sold by
Wiltse Estate Adele
Bought by
Messler Trust Neeld J & Catherine
Create a Home Valuation Report for This Property
The Home Valuation Report is an in-depth analysis detailing your home's value as well as a comparison with similar homes in the area
Home Values in the Area
Average Home Value in this Area
Purchase History
| Date | Buyer | Sale Price | Title Company |
|---|---|---|---|
| M & L Dougherty Enterprises Llc | $13,500 | -- | |
| Spinner Steven Eugene | -- | -- | |
| Messler Trust Neeld J & Catherine | -- | -- | |
| Messler Trust Neeld J & Catherine | -- | -- |
Source: Public Records
Tax History Compared to Growth
Tax History
| Year | Tax Paid | Tax Assessment Tax Assessment Total Assessment is a certain percentage of the fair market value that is determined by local assessors to be the total taxable value of land and additions on the property. | Land | Improvement |
|---|---|---|---|---|
| 2025 | $361 | $29,810 | $3,480 | $26,330 |
| 2024 | $361 | $28,320 | $3,480 | $24,840 |
| 2023 | $294 | $17,942 | $3,480 | $14,462 |
| 2022 | $298 | $15,521 | $1,566 | $13,955 |
| 2021 | $293 | $15,615 | $1,566 | $14,049 |
| 2020 | $283 | $14,946 | $1,566 | $13,380 |
| 2019 | $280 | $14,556 | $1,566 | $12,990 |
| 2018 | $275 | $14,178 | $1,566 | $12,612 |
| 2017 | $276 | $14,178 | $1,566 | $12,612 |
| 2016 | $267 | $13,811 | $1,566 | $12,245 |
| 2015 | $268 | $13,811 | $1,566 | $12,245 |
| 2014 | $268 | $13,811 | $1,566 | $12,245 |
Source: Public Records
Map
Nearby Homes