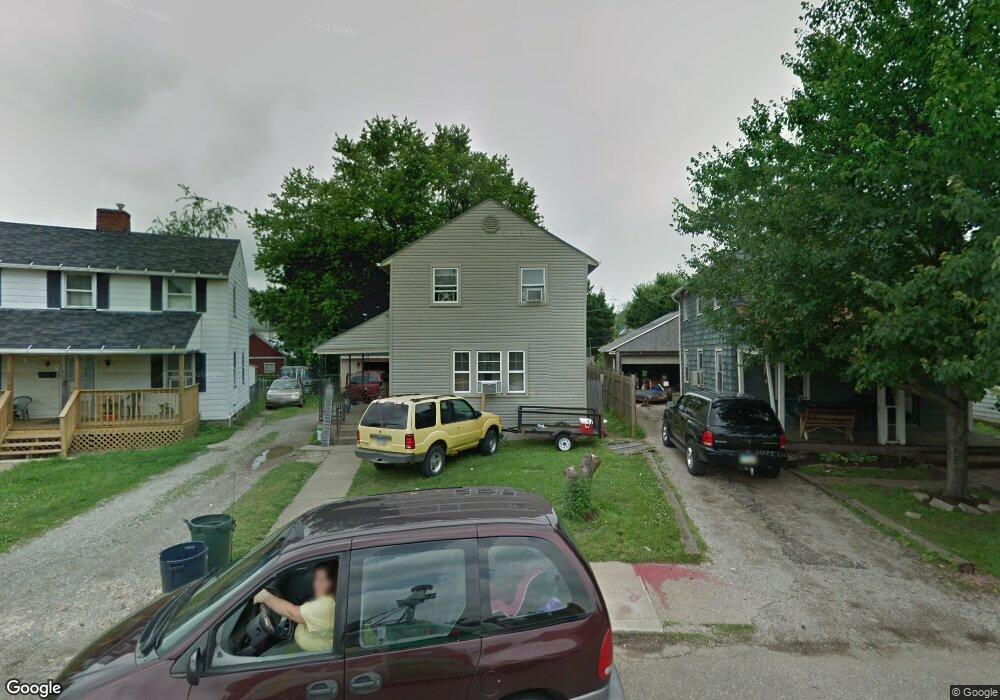
1415 Crescent Rd SW Canton, OH 44710
Souers NeighborhoodEstimated Value: $102,824 - $129,000
3
Beds
1
Bath
1,260
Sq Ft
$90/Sq Ft
Est. Value
About This Home
This home is located at 1415 Crescent Rd SW, Canton, OH 44710 and is currently estimated at $113,456, approximately $90 per square foot. 1415 Crescent Rd SW is a home located in Stark County with nearby schools including Harter Elementary School, Early Learning Center @ Schreiber, and McGregor Elementary School.
Ownership History
Date
Name
Owned For
Owner Type
Purchase Details
Closed on
Mar 23, 2005
Sold by
Zeno Michele
Bought by
Tichenor William D and Tichenor Belinda
Current Estimated Value
Home Financials for this Owner
Home Financials are based on the most recent Mortgage that was taken out on this home.
Original Mortgage
$73,742
Outstanding Balance
$37,385
Interest Rate
5.61%
Mortgage Type
FHA
Estimated Equity
$76,071
Purchase Details
Closed on
Jul 26, 2001
Sold by
Hud Secry
Bought by
Zeno Michele
Purchase Details
Closed on
Jun 19, 2000
Sold by
Williamson Cary L
Bought by
Hud
Purchase Details
Closed on
Sep 2, 1999
Sold by
Williamson Cary L and Williamson John
Bought by
Hud
Purchase Details
Closed on
Jul 30, 1996
Sold by
Brown Mary E
Bought by
Williamson Cary L
Home Financials for this Owner
Home Financials are based on the most recent Mortgage that was taken out on this home.
Original Mortgage
$39,900
Interest Rate
8.43%
Mortgage Type
FHA
Create a Home Valuation Report for This Property
The Home Valuation Report is an in-depth analysis detailing your home's value as well as a comparison with similar homes in the area
Home Values in the Area
Average Home Value in this Area
Purchase History
| Date | Buyer | Sale Price | Title Company |
|---|---|---|---|
| Tichenor William D | $74,900 | Americas Choice Title Agency | |
| Zeno Michele | $30,678 | Gateway Title Agency Inc | |
| Hud | $41,000 | -- | |
| Hud | $41,000 | -- | |
| Williamson Cary L | $39,900 | -- |
Source: Public Records
Mortgage History
| Date | Status | Borrower | Loan Amount |
|---|---|---|---|
| Open | Tichenor William D | $73,742 | |
| Previous Owner | Williamson Cary L | $39,900 |
Source: Public Records
Tax History Compared to Growth
Tax History
| Year | Tax Paid | Tax Assessment Tax Assessment Total Assessment is a certain percentage of the fair market value that is determined by local assessors to be the total taxable value of land and additions on the property. | Land | Improvement |
|---|---|---|---|---|
| 2025 | -- | $26,040 | $4,690 | $21,350 |
| 2024 | -- | $26,040 | $4,690 | $21,350 |
| 2023 | $1,149 | $18,840 | $4,310 | $14,530 |
| 2022 | $560 | $18,840 | $4,310 | $14,530 |
| 2021 | $1,132 | $18,840 | $4,310 | $14,530 |
| 2020 | $1,031 | $15,370 | $3,570 | $11,800 |
| 2019 | $904 | $15,370 | $3,570 | $11,800 |
| 2018 | $910 | $15,370 | $3,570 | $11,800 |
| 2017 | $990 | $15,230 | $3,500 | $11,730 |
| 2016 | $993 | $15,230 | $3,500 | $11,730 |
| 2015 | $999 | $15,230 | $3,500 | $11,730 |
| 2014 | $1,109 | $15,890 | $3,640 | $12,250 |
| 2013 | $534 | $15,890 | $3,640 | $12,250 |
Source: Public Records
Map
Nearby Homes
- 3204 14th St SW
- 1319 Maryland Ave SW
- 3040 13th St SW
- 1246 Raff Rd SW
- 2918 17th St SW
- 1548 Tanner Ave SW
- 1263 Homewood Ave SW
- 1729 Gambrinus Ave SW
- 1251 Homewood Ave SW
- 1118 Raff Rd SW
- 1712 Clarendon Ave SW
- 929 Wertz Ave SW
- 3831 11th St SW
- 1019 Dartmouth Ave SW
- 846 Maryland Ave SW
- 900 Raff Rd SW
- 2420 Clyde Place SW
- 712 Shadyside Ave SW
- 1815 Vine Ave SW
- 921 Clarendon Ave SW
- 1411 Crescent Rd SW
- 1419 Crescent Rd SW
- 1421 Crescent Rd SW
- 1414 Roslyn Ave SW
- 1418 Roslyn Ave SW
- 1405 Crescent Rd SW
- 1412 Roslyn Ave SW
- 3210 14th St SW
- 1426 Roslyn Ave SW
- 3227 Arbor Rd SW
- 3235 Arbor Rd SW
- 3225 Arbor Rd SW
- 3214 14th St SW
- 1404 Roslyn Ave SW
- 3219 Arbor Rd SW
- 1501 Maryland Ave SW
- 3215 Arbor Rd SW
- 1505 Maryland Ave SW
- 1511 Maryland Ave SW
- 3211 14th St SW