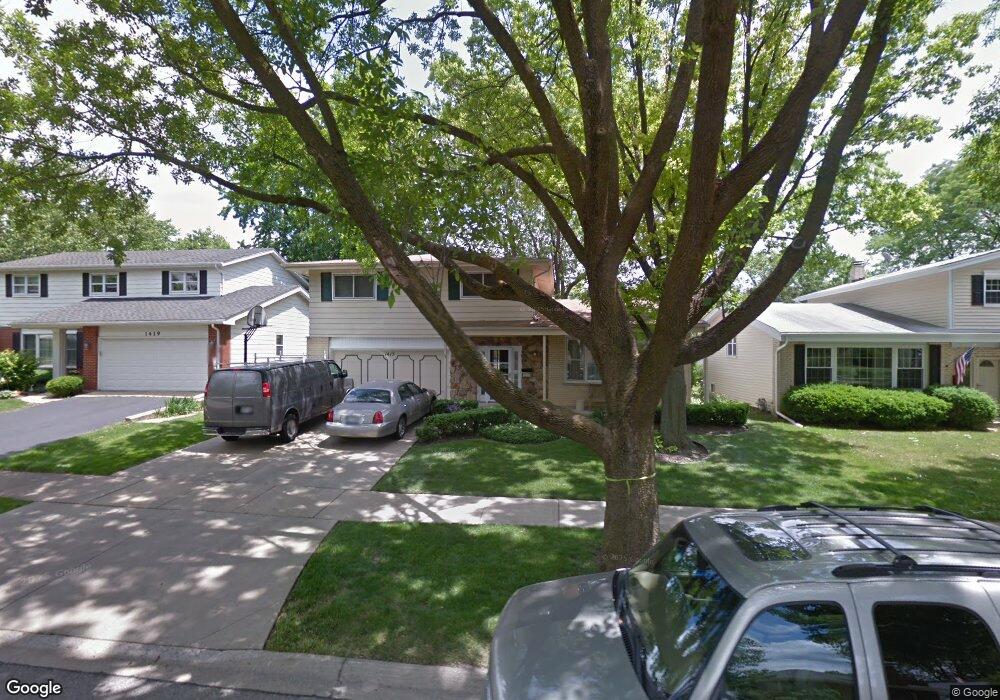
1415 N Chestnut Ave Arlington Heights, IL 60004
Estimated Value: $639,289 - $719,000
4
Beds
3
Baths
2,230
Sq Ft
$303/Sq Ft
Est. Value
About This Home
This home is located at 1415 N Chestnut Ave, Arlington Heights, IL 60004 and is currently estimated at $676,572, approximately $303 per square foot. 1415 N Chestnut Ave is a home located in Cook County with nearby schools including Olive-Mary Stitt Elementary School, Thomas Middle School, and John Hersey High School.
Ownership History
Date
Name
Owned For
Owner Type
Purchase Details
Closed on
Aug 4, 2018
Sold by
Bolash John M and Bolash Debra R
Bought by
Garb John J and Garb Jane V H
Current Estimated Value
Create a Home Valuation Report for This Property
The Home Valuation Report is an in-depth analysis detailing your home's value as well as a comparison with similar homes in the area
Home Values in the Area
Average Home Value in this Area
Purchase History
| Date | Buyer | Sale Price | Title Company |
|---|---|---|---|
| Garb John J | $450,000 | Fidelity National Title |
Source: Public Records
Tax History Compared to Growth
Tax History
| Year | Tax Paid | Tax Assessment Tax Assessment Total Assessment is a certain percentage of the fair market value that is determined by local assessors to be the total taxable value of land and additions on the property. | Land | Improvement |
|---|---|---|---|---|
| 2024 | $11,132 | $43,979 | $7,920 | $36,059 |
| 2023 | $10,694 | $43,979 | $7,920 | $36,059 |
| 2022 | $10,694 | $43,979 | $7,920 | $36,059 |
| 2021 | $11,189 | $40,500 | $4,950 | $35,550 |
| 2020 | $10,966 | $40,500 | $4,950 | $35,550 |
| 2019 | $10,915 | $45,000 | $4,950 | $40,050 |
| 2018 | $11,280 | $42,088 | $4,356 | $37,732 |
| 2017 | $11,164 | $42,088 | $4,356 | $37,732 |
| 2016 | $10,649 | $42,088 | $4,356 | $37,732 |
| 2015 | $10,380 | $37,776 | $3,762 | $34,014 |
| 2014 | $7,963 | $30,350 | $3,762 | $26,588 |
| 2013 | $7,746 | $30,350 | $3,762 | $26,588 |
Source: Public Records
Map
Nearby Homes
- 1317 N Mitchell Ave
- 1237 N Ridge Ave
- 1142 N Mitchell Ave
- 1136 N Walnut Ave
- 1653 N Belmont Ct Unit 31
- 910 N Chestnut Ave
- 25 E Palatine Rd Unit 207
- 25 E Palatine Rd Unit 303
- 1518 N Patton Ave
- 1670 N Douglas Ct Unit 86
- 827 N Walnut Ave
- 1825 N Kaspar Ave
- 1416 W Lynnwood Ave
- 1418 W Maude Ave
- 703 N Arlington Heights Rd
- 1605 N Chicago Ave
- 2020 N Chestnut Ave
- 1326 N Race Ave
- 1750 W Thomas St
- 300 E Euclid Ave
- 1419 N Chestnut Ave
- 1423 N Chestnut Ave
- 1407 N Chestnut Ave
- 1416 N Highland Ave
- 1420 N Highland Ave
- 1412 N Highland Ave
- 1424 N Highland Ave
- 1427 N Chestnut Ave
- 216 W Marion St
- 1408 N Highland Ave
- 1414 N Chestnut Ave
- 1408 N Chestnut Ave
- 1418 N Chestnut Ave
- 1428 N Highland Ave
- 204 W Marion St
- 1406 N Chestnut Ave
- 1431 N Chestnut Ave
- 306 W Marion St
- 1434 N Highland Ave
- 1435 N Chestnut Ave