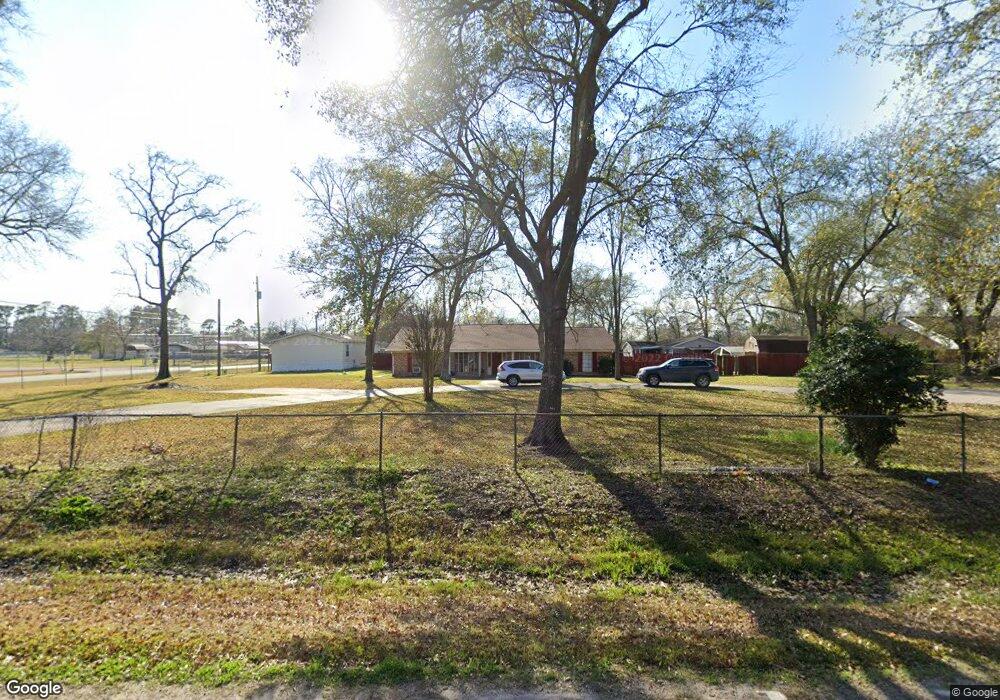
1415 Park Dr Channelview, TX 77530
Estimated Value: $396,000 - $595,276
5
Beds
5
Baths
5,270
Sq Ft
$96/Sq Ft
Est. Value
About This Home
This home is located at 1415 Park Dr, Channelview, TX 77530 and is currently estimated at $504,569, approximately $95 per square foot. 1415 Park Dr is a home located in Harris County with nearby schools including Channelview High School.
Ownership History
Date
Name
Owned For
Owner Type
Purchase Details
Closed on
Feb 8, 2023
Sold by
Macneill Brenda
Bought by
Moore Tiffany
Current Estimated Value
Purchase Details
Closed on
Oct 12, 2022
Sold by
Holley James R
Bought by
Macneill Brenda
Purchase Details
Closed on
Sep 14, 2022
Sold by
Wright Buddy C and Wright Vicky D
Bought by
Acevedo Jose Antonio Eerr and Gonzalez Ana Dianelys
Purchase Details
Closed on
Apr 30, 2019
Sold by
Howell Bernice
Bought by
Holley Juanice
Purchase Details
Closed on
May 4, 2005
Sold by
Putnam Dorothy Worsham and Cox Christina
Bought by
Howell Bernice
Home Financials for this Owner
Home Financials are based on the most recent Mortgage that was taken out on this home.
Original Mortgage
$21,000
Interest Rate
6.06%
Mortgage Type
Purchase Money Mortgage
Purchase Details
Closed on
Jan 4, 2005
Sold by
Carlisle Brian
Bought by
Putnam Dorothy Ruth
Create a Home Valuation Report for This Property
The Home Valuation Report is an in-depth analysis detailing your home's value as well as a comparison with similar homes in the area
Home Values in the Area
Average Home Value in this Area
Purchase History
| Date | Buyer | Sale Price | Title Company |
|---|---|---|---|
| Moore Tiffany | -- | None Listed On Document | |
| Macneill Brenda | -- | -- | |
| Acevedo Jose Antonio Eerr | -- | Capital Title | |
| Holley Juanice | -- | None Available | |
| Howell Bernice | -- | Commonwealth | |
| Putnam Dorothy Ruth | -- | -- |
Source: Public Records
Mortgage History
| Date | Status | Borrower | Loan Amount |
|---|---|---|---|
| Previous Owner | Howell Bernice | $21,000 |
Source: Public Records
Tax History Compared to Growth
Tax History
| Year | Tax Paid | Tax Assessment Tax Assessment Total Assessment is a certain percentage of the fair market value that is determined by local assessors to be the total taxable value of land and additions on the property. | Land | Improvement |
|---|---|---|---|---|
| 2025 | $8,700 | $645,087 | $188,900 | $456,187 |
| 2024 | $8,700 | $578,685 | $165,288 | $413,397 |
| 2023 | $8,700 | $600,734 | $165,288 | $435,446 |
| 2022 | $11,132 | $543,684 | $141,675 | $402,009 |
| 2021 | $11,273 | $584,248 | $94,450 | $489,798 |
| 2020 | $10,654 | $483,843 | $85,005 | $398,838 |
| 2019 | $9,856 | $445,629 | $85,005 | $360,624 |
| 2018 | $154 | $397,862 | $85,005 | $312,857 |
| 2017 | $8,156 | $397,862 | $59,031 | $338,831 |
| 2016 | $7,414 | $389,776 | $59,031 | $330,745 |
| 2015 | $1,039 | $333,754 | $59,031 | $274,723 |
| 2014 | $1,039 | $309,783 | $46,531 | $263,252 |
Source: Public Records
Map
Nearby Homes
- 17119 Water Oak Dr
- 16600 Laurelwood Dr
- 00 Laurelwood Dr
- 16811 Forest Trail Dr
- 17102 River Rd
- 16736 Forest Trail Dr
- 16725 Shady Ln
- 0 Laurelwood Dr Unit 43034610
- 16326 Bear Bayou Dr
- 16931 Avenue B
- 17513 River Rd
- 17202 Meadowbrook Dr
- 17325 River Rd
- 16219 Bear Bayou 1 2 Dr
- 17427 Moreland Dr
- 1211 Pecan St
- 16121 Bear Bayou Dr Unit 13
- 16134 Palm St
- 17512 River Rd
- 16809 Market St