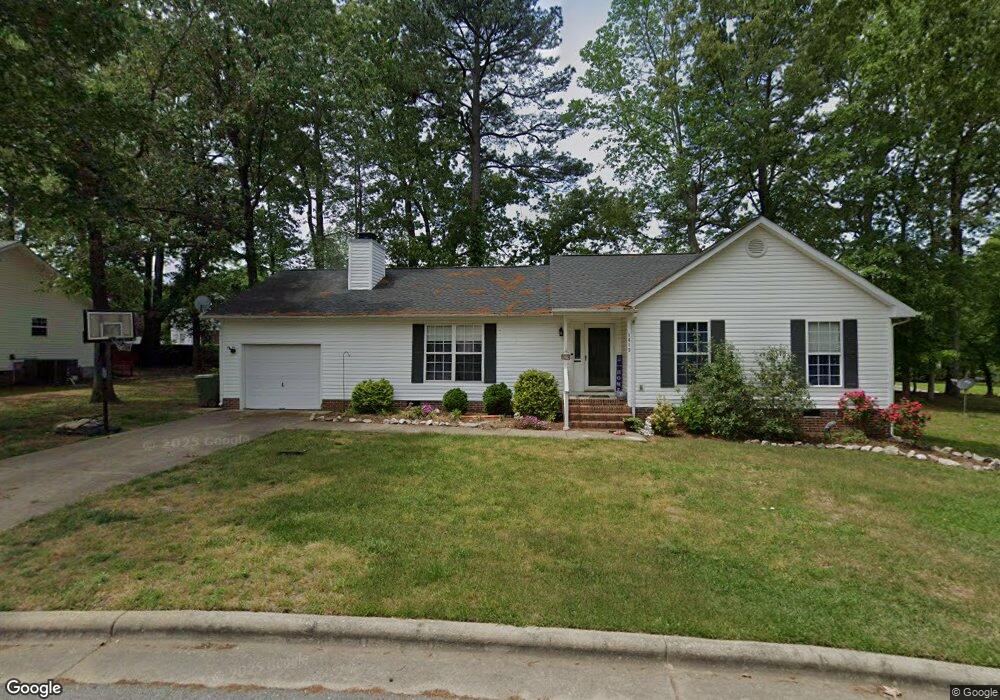
1415 Poplar Ridge Rd Fuquay Varina, NC 27526
Estimated Value: $336,000 - $351,798
3
Beds
2
Baths
1,538
Sq Ft
$224/Sq Ft
Est. Value
About This Home
This home is located at 1415 Poplar Ridge Rd, Fuquay Varina, NC 27526 and is currently estimated at $344,450, approximately $223 per square foot. 1415 Poplar Ridge Rd is a home located in Wake County with nearby schools including Holly Grove Middle School, Fuquay-Varina High, and Southern Wake Academy.
Ownership History
Date
Name
Owned For
Owner Type
Purchase Details
Closed on
Aug 11, 2016
Sold by
Zsoldos Caroll
Bought by
Larrick Joyce E and Larrick George M
Current Estimated Value
Home Financials for this Owner
Home Financials are based on the most recent Mortgage that was taken out on this home.
Original Mortgage
$137,120
Outstanding Balance
$109,406
Interest Rate
3.48%
Mortgage Type
New Conventional
Estimated Equity
$235,044
Purchase Details
Closed on
Aug 3, 2009
Sold by
Batchelor Jerry Lynn and Batchelor Brenda
Bought by
Zsoldos Carol
Home Financials for this Owner
Home Financials are based on the most recent Mortgage that was taken out on this home.
Original Mortgage
$145,000
Interest Rate
4.75%
Mortgage Type
New Conventional
Purchase Details
Closed on
Mar 21, 2003
Sold by
Walters Group Properties Llc
Bought by
Batchelor Jerry Lynn
Purchase Details
Closed on
Jun 17, 2002
Sold by
Walters Eva M
Bought by
Walters Group Properties Llc
Create a Home Valuation Report for This Property
The Home Valuation Report is an in-depth analysis detailing your home's value as well as a comparison with similar homes in the area
Home Values in the Area
Average Home Value in this Area
Purchase History
| Date | Buyer | Sale Price | Title Company |
|---|---|---|---|
| Larrick Joyce E | $171,500 | None Available | |
| Zsoldos Carol | $144,000 | None Available | |
| Batchelor Jerry Lynn | $337,000 | -- | |
| Walters Group Properties Llc | -- | -- |
Source: Public Records
Mortgage History
| Date | Status | Borrower | Loan Amount |
|---|---|---|---|
| Open | Larrick Joyce E | $137,120 | |
| Previous Owner | Zsoldos Carol | $145,000 |
Source: Public Records
Tax History Compared to Growth
Tax History
| Year | Tax Paid | Tax Assessment Tax Assessment Total Assessment is a certain percentage of the fair market value that is determined by local assessors to be the total taxable value of land and additions on the property. | Land | Improvement |
|---|---|---|---|---|
| 2025 | $2,894 | $328,382 | $95,000 | $233,382 |
| 2024 | $2,882 | $328,382 | $95,000 | $233,382 |
| 2023 | $2,493 | $222,369 | $43,000 | $179,369 |
| 2022 | $2,343 | $222,369 | $43,000 | $179,369 |
| 2021 | $2,233 | $222,369 | $43,000 | $179,369 |
| 2020 | $2,233 | $222,369 | $43,000 | $179,369 |
| 2019 | $1,814 | $155,543 | $37,000 | $118,543 |
| 2018 | $1,711 | $155,543 | $37,000 | $118,543 |
| 2017 | $1,649 | $155,543 | $37,000 | $118,543 |
| 2016 | -- | $155,543 | $37,000 | $118,543 |
| 2015 | $1,508 | $148,859 | $35,000 | $113,859 |
| 2014 | $1,454 | $148,859 | $35,000 | $113,859 |
Source: Public Records
Map
Nearby Homes
- 1728 Balfour Downs Cir
- 1020 Garrow Dr
- 1726 Stroll Cir
- 316 Edgecroft Way
- 328 Edgecroft Way
- 1919 Stroll Cir
- 1707 Stroll Cir
- 1210 Briar Gate Dr
- 1017 Quindell Dr
- 552 Stobhill Ln
- 1308 Mcfarlan Ct
- 176 Breezemont Dr
- 1894 Landstrom Ln
- 916 Briar Gate Dr
- 151 Stobhill Ln
- 2113 Feather Ridge Dr
- 809 Briar Gate Dr
- 412 Stobhill Ln
- 885 Wilbon Rd
- 945 Wilbon Rd
- 1417 Poplar Ridge Rd
- 1413 Poplar Ridge Rd
- 1520 Twin Lake Dr
- 607 Wyndham Dr
- 1414 Poplar Ridge Rd
- 1411 Poplar Ridge Rd
- 1501 Poplar Ridge Rd
- 1521 Twin Lake Dr
- 1412 Poplar Ridge Rd
- 1516 Twin Lake Dr
- 1525 Twin Lake Dr
- 1500 Poplar Ridge Rd
- 1503 Poplar Ridge Rd
- 1409 Poplar Ridge Rd
- 602 Wyndham Dr
- 602 Wyndham Dr
- 1601 Twin Lake Dr
- 603 Wyndham Dr
- 1410 Poplar Ridge Rd
- 1407 Poplar Ridge Rd