Estimated Value: $396,000 - $451,000
3
Beds
3
Baths
3,620
Sq Ft
$118/Sq Ft
Est. Value
About This Home
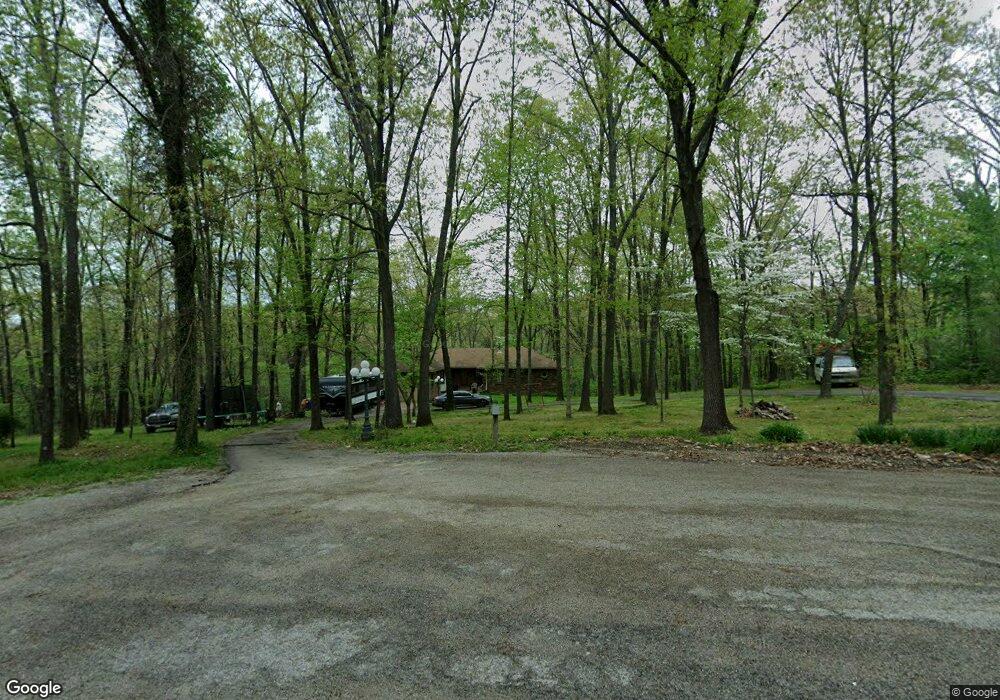
This home is located at 1415 S Thousand Oaks Dr, Nixa, MO 65714 and is currently estimated at $427,336, approximately $118 per square foot. 1415 S Thousand Oaks Dr is a home located in Christian County with nearby schools including Mathews Elementary School, Queens Gateway to Health Sciences Secondary School, and Nicholas A. Inman Intermediate School.
Ownership History
Date
Name
Owned For
Owner Type
Purchase Details
Closed on
Apr 5, 2019
Sold by
Felty Bradford E and Felty Jamie Lee
Bought by
Mickelson James and Mickelson Brittney G
Current Estimated Value
Home Financials for this Owner
Home Financials are based on the most recent Mortgage that was taken out on this home.
Original Mortgage
$184,300
Outstanding Balance
$162,032
Interest Rate
4.3%
Mortgage Type
New Conventional
Estimated Equity
$265,304
Purchase Details
Closed on
Dec 27, 2013
Sold by
Felty Bradford E and Felty Jamie Lee
Bought by
Felty Bradford and Felty Jamie Lee
Purchase Details
Closed on
Nov 23, 2009
Sold by
Bollinger Jacob
Bought by
Felty Bradford E and Felty Jamie Lee
Home Financials for this Owner
Home Financials are based on the most recent Mortgage that was taken out on this home.
Original Mortgage
$214,515
Interest Rate
4.99%
Mortgage Type
VA
Create a Home Valuation Report for This Property
The Home Valuation Report is an in-depth analysis detailing your home's value as well as a comparison with similar homes in the area
Home Values in the Area
Average Home Value in this Area
Purchase History
| Date | Buyer | Sale Price | Title Company |
|---|---|---|---|
| Mickelson James | -- | Meridian Title Company Llc | |
| Mickelson Brittney G | -- | Meridian Title Company Llc | |
| Felty Bradford | -- | Choice Escrow Land Title Inc | |
| Felty Bradford E | -- | Choice Escrow & Land Title L |
Source: Public Records
Mortgage History
| Date | Status | Borrower | Loan Amount |
|---|---|---|---|
| Open | Mickelson Brittney G | $184,300 | |
| Closed | Mickelson James | $15,000 | |
| Previous Owner | Felty Bradford E | $214,515 |
Source: Public Records
Tax History Compared to Growth
Tax History
| Year | Tax Paid | Tax Assessment Tax Assessment Total Assessment is a certain percentage of the fair market value that is determined by local assessors to be the total taxable value of land and additions on the property. | Land | Improvement |
|---|---|---|---|---|
| 2024 | $2,186 | $36,840 | -- | -- |
| 2023 | $2,186 | $36,840 | $0 | $0 |
| 2022 | $2,015 | $33,920 | $0 | $0 |
| 2021 | $2,016 | $33,920 | $0 | $0 |
| 2020 | $1,818 | $29,240 | $0 | $0 |
| 2019 | $1,818 | $29,240 | $0 | $0 |
| 2018 | $1,686 | $29,240 | $0 | $0 |
| 2017 | $1,686 | $29,240 | $0 | $0 |
| 2016 | $1,657 | $29,240 | $0 | $0 |
| 2015 | $1,660 | $29,240 | $29,240 | $0 |
| 2014 | $1,627 | $29,430 | $0 | $0 |
| 2013 | $16 | $29,430 | $0 | $0 |
| 2011 | $16 | $58,860 | $0 | $0 |
Source: Public Records
Map
Nearby Homes
- 1642 W Inman Rd
- 1286 S River Bend Ct
- 1137 S Gregg Rd
- 202 N Cheyenne Valley Rd
- 506 N Cheyenne Valley Rd
- 504 N Cheyenne Valley Rd
- 206 N Cheyenne Valley Rd
- 404 N Cheyenne Valley Rd
- 1340 W Mesa Dr
- 975 S Pinewood Ln
- 708 S Aurora Ct
- 1013 W Sunny Slopes Dr
- 1222 W Butterfield Dr
- 176 Shooting Star Ln
- 1209 W Belwood Ct
- 701 S Cedarwood Ct
- 440 W White Ash Rd
- 000 S Nicholas Rd
- Lot 9 Kelby Creek Phase 4
- Lot 5 Kelby Creek Phase 4
- 1414 S Thousand Oaks Dr
- Tract # 7 Thousand Oaks
- 1417 S Thousand Oaks Dr
- 1418 S Thousand Oaks Dr
- 1419 S Thousand Oaks Dr
- 1413 S Thousand Oaks Dr
- 1420 S Thousand Oaks Dr
- 1421 S Thousand Oaks Dr
- 1422 S Thousand Oaks Dr
- 1426 S Thousand Oaks Dr
- 1412 S Thousand Oaks Dr
- 1416 S Thousand Oaks Dr
- 1425 S Thousand Oaks Dr
- 1424 S Thousand Oaks Dr
- 1423 S Thousand Oaks Dr
- 1408 S Thousand Oaks Dr
- 1409 S Thousand Oaks Dr
- 1411 S Thousand Oaks Dr
- 1401 S Thousand Oaks Dr
- 1402 S Thousand Oaks Dr