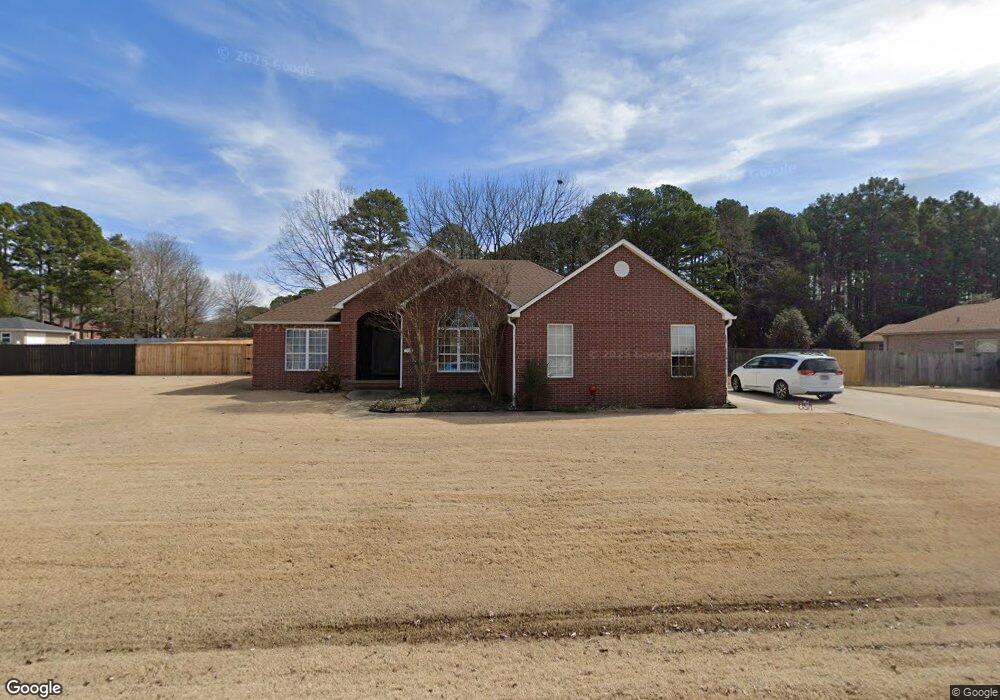
1415 Summer Heights Dr Heber Springs, AR 72543
Estimated Value: $302,000 - $346,000
--
Bed
2
Baths
1,976
Sq Ft
$166/Sq Ft
Est. Value
About This Home
This home is located at 1415 Summer Heights Dr, Heber Springs, AR 72543 and is currently estimated at $327,738, approximately $165 per square foot. 1415 Summer Heights Dr is a home located in Cleburne County with nearby schools including Heber Springs Elementary School, Heber Springs Middle School, and Heber Springs High School.
Ownership History
Date
Name
Owned For
Owner Type
Purchase Details
Closed on
Mar 31, 2017
Sold by
Jeffrey John D and Jeffrey Lona J
Bought by
John D And Lona J Jeffrey Joint Living T
Current Estimated Value
Purchase Details
Closed on
Jun 9, 2016
Sold by
Pettigrew Kenneth E
Bought by
Jeffrey John David and John David Jeffrey Living Trust
Purchase Details
Closed on
Dec 2, 2008
Sold by
Hand James L
Bought by
Hand James L and Hand Revocable Trust
Purchase Details
Closed on
May 29, 2001
Bought by
Hand James L
Purchase Details
Closed on
Aug 25, 2000
Bought by
Lance Reynolds Construction, Inc
Purchase Details
Closed on
May 15, 2000
Bought by
Clebco Development, Inc
Purchase Details
Closed on
Feb 10, 2000
Bought by
Reylance, Inc
Create a Home Valuation Report for This Property
The Home Valuation Report is an in-depth analysis detailing your home's value as well as a comparison with similar homes in the area
Home Values in the Area
Average Home Value in this Area
Purchase History
| Date | Buyer | Sale Price | Title Company |
|---|---|---|---|
| John D And Lona J Jeffrey Joint Living T | -- | None Available | |
| Jeffrey John David | $175,000 | Cornerstone Title | |
| Hand James L | -- | None Available | |
| Hand James L | $140,000 | -- | |
| Lance Reynolds Construction, Inc | -- | -- | |
| Clebco Development, Inc | -- | -- | |
| Clebco Development, Inc | $900,000 | -- | |
| Reylance, Inc | -- | -- |
Source: Public Records
Tax History Compared to Growth
Tax History
| Year | Tax Paid | Tax Assessment Tax Assessment Total Assessment is a certain percentage of the fair market value that is determined by local assessors to be the total taxable value of land and additions on the property. | Land | Improvement |
|---|---|---|---|---|
| 2024 | $1,314 | $48,572 | $3,000 | $45,572 |
| 2023 | $1,389 | $48,572 | $3,000 | $45,572 |
| 2022 | $1,356 | $48,572 | $3,000 | $45,572 |
| 2021 | $1,274 | $38,346 | $3,000 | $35,346 |
| 2020 | $1,274 | $38,346 | $3,000 | $35,346 |
| 2019 | $1,274 | $38,346 | $3,000 | $35,346 |
| 2018 | $1,291 | $38,346 | $3,000 | $35,346 |
| 2017 | $1,272 | $38,346 | $3,000 | $35,346 |
| 2016 | $643 | $23,480 | $1,700 | $21,780 |
| 2015 | $643 | $23,480 | $1,700 | $21,780 |
| 2014 | -- | $23,480 | $1,700 | $21,780 |
Source: Public Records
Map
Nearby Homes
- 1401 Roe's Ridge
- 1602 Roe's Ridge
- 404 Trailwood Dr
- 1412 Ridgefield Dr
- 863 Copperfield Cove
- 209 Trailwood Dr
- Lot 26 Scenic Place
- 2195 Achoma Dr
- 2255 Highway 25b
- 1835 Heber Springs Rd N
- 2421 Hwy 25b N
- 705 N Park St
- 307 Lo Hawk Dr
- 710 N Broadway St
- 429 E Moore St
- Lot 16 Wisdom Pointe
- 502 E Clinton St
- 000 Arkansas 25 Bypass
- Lot 4 Thelma St
- 508 Mustang Dr
- 1417 Summer Heights Dr
- 1411 Summer Heights Dr
- 901 Pineknot Ln
- 1410 Summer Heights Dr
- 1505 Summer Heights
- 1407 Summer Heights Dr
- 902 Blackberry Ln
- 902 Biroja St Ln
- 1509 Summer Heights
- 1406 Summer Heights Dr
- 903 Pineknot Ln
- 1502 Summer Heights Dr
- 900 Pineknot Ln
- 806 Summer Heights Dr
- 0 Blackberry Ln Unit 16022897
- 0 Blackberry Ln Unit 20036561
- 0 Blackberry Ln Unit 20031086
- 904 Blackberry Ln
- 808 Summer Trail Dr
- 808 Summer Trail